Personal Finance
Chart: Most Millennials Have Less Than $1,000 in Savings
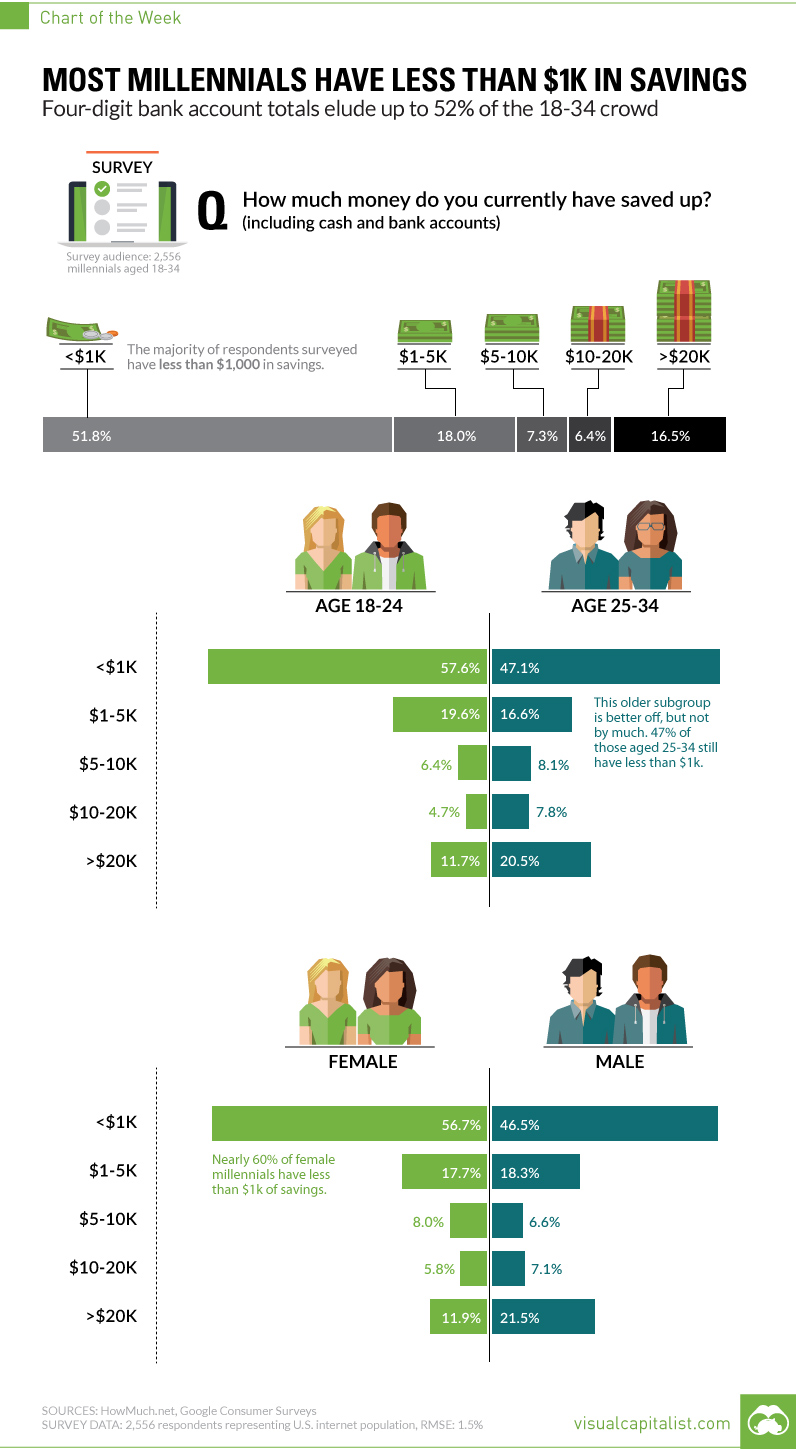
Chart: Most Millennials Have Less Than $1,000 in Savings
Four-digit bank account totals elude 52% of the 18-34 crowd
The Chart of the Week is a weekly Visual Capitalist feature on Fridays.
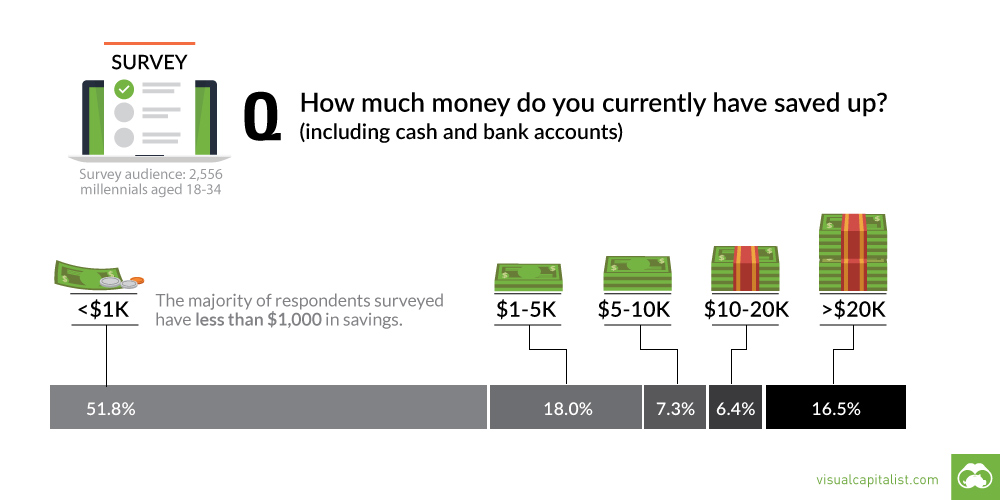
The majority of millennials are living paycheck to paycheck.
A recent survey of millennials by HowMuch.net found that 51.8% of those aged 18-34 have less than $1,000 held between bank accounts and cash savings.
This echoes previous data we’ve seen – not just on millennials, but Americans in general. For example, we know that 14% of Americans have “negative” wealth. We also know that 62% of Americans don’t have emergency savings that could cover a $1,000 hospital visit or a $500 car repair.
Taking that into consideration, let’s dive deeper into this more recent millennial data.
Younger vs. Older Millennials
The broad survey data can be further divided into “younger” and “older” millennial segments: those aged 18-24, vs. those between 25-34.
Based on the survey question, an intuitive expectation would be that younger millennials are much more likely to have less than $1,000 in savings. After all, many of the people in this group would still be in school, and many are struggling with student debt.
However, the difference is far less than one may expect. While it is true that 57.6% of the younger demographic has less than $1,000 in savings, the older group is not much better off with almost half (47.1%) of them being in the same boat. This shows that many millennials in their late 20s and early 30s are still not able to generate substantial savings.
Male vs. Female Millennials
There is also a significant divide between male and female millennials here, with 56.7% of females having less than $1,000 in savings. Compare this number to the male percentage of 46.5%, and it is clear there is a substantial divide between genders.
Lastly, males are also more likely to have a substantial amount stored away in their bank account. According to the survey, 21.5% of males have more than $20,000 of savings, while only 11.9% females can say the same.


Personal Finance
Chart: The Declining Value of the U.S. Federal Minimum Wage
This graphic compares the nominal vs. inflation-adjusted value of the U.S. minimum wage, from 1940 to 2023.


The Declining Value of the U.S. Federal Minimum Wage
This was originally posted on our Voronoi app. Download the app for free on iOS or Android and discover incredible data-driven charts from a variety of trusted sources.
This graphic illustrates the history of the U.S. federal minimum wage using data compiled by Statista, in both nominal and real (inflation-adjusted) terms. The federal minimum wage was raised to $7.25 per hour in July 2009, where it has remained ever since.
Nominal vs. Real Value
The data we used to create this graphic can be found in the table below.
| Year | Nominal value ($/hour) | Real value ($/hour) |
|---|---|---|
| 1940 | 0.3 | 6.5 |
| 1945 | 0.4 | 6.82 |
| 1950 | 0.75 | 9.64 |
| 1955 | 0.75 | 8.52 |
| 1960 | 1 | 10.28 |
| 1965 | 1.25 | 12.08 |
| 1970 | 1.6 | 12.61 |
| 1975 | 2.1 | 12.04 |
| 1980 | 3.1 | 11.61 |
| 1985 | 3.35 | 9.51 |
| 1990 | 3.8 | 8.94 |
| 1995 | 4.25 | 8.49 |
| 2000 | 5.15 | 9.12 |
| 2005 | 5.15 | 8.03 |
| 2010 | 7.25 | 10.09 |
| 2015 | 7.25 | 9.3 |
| 2018 | 7.25 | 8.78 |
| 2019 | 7.25 | 8.61 |
| 2020 | 7.25 | 8.58 |
| 2021 | 7.25 | 8.24 |
| 2022 | 7.25 | 7.61 |
| 2023 | 7.25 | 7.25 |
What our graphic shows is how inflation has eroded the real value of the U.S. minimum wage over time, despite nominal increases.
For instance, consider the year 1960, when the federal minimum wage was $1 per hour. After accounting for inflation, this would be worth around $10.28 today!
The two lines converge at 2023 because the nominal and real value are identical in present day terms.
Many States Have Their Own Minimum Wage
According to the National Conference of State Legislatures (NCSL), 30 states and Washington, D.C. have implemented a minimum wage that is higher than $7.25.
The following states have adopted the federal minimum: Georgia, Idaho, Indiana, Iowa, Kansas, Kentucky, New Hampshire, North Carolina, North Dakota, Oklahoma, Pennsylvania, Texas, Utah, Wisconsin, and Wyoming.
Meanwhile, the states of Alabama, Louisiana, Mississippi, South Carolina, and Tennessee have no wage minimums, but have to follow the federal minimum.
How Does the U.S. Minimum Wage Rank Globally?
If you found this topic interesting, check out Mapped: Minimum Wage Around the World to see which countries have the highest minimum wage in monthly terms, as of January 2023.

-

 Travel1 week ago
Airline Incidents: How Do Boeing and Airbus Compare?
-

 Markets3 weeks ago
Visualizing America’s Shortage of Affordable Homes
-

 Green2 weeks ago
Ranked: Top Countries by Total Forest Loss Since 2001
-

 Money2 weeks ago
Where Does One U.S. Tax Dollar Go?
-

 Misc2 weeks ago
Almost Every EV Stock is Down After Q1 2024
-

 AI2 weeks ago
The Stock Performance of U.S. Chipmakers So Far in 2024
-

 Markets2 weeks ago
Charted: Big Four Market Share by S&P 500 Audits
-

 Real Estate2 weeks ago
Ranked: The Most Valuable Housing Markets in America