Google's Shopping Insights tool has proven most useful for retailers. It helps them understand where customers are who are looking for their products and what devices (laptops, mobile phones) those customers are using. If a retailer has a store in that area, it can use those insights to plan marketing campaigns and promotions.
More than 87% of shoppers look for information before entering a store, 79% while visiting a store, and 35% after visiting a store, according to Google. So today's consumers are definitely smarter than ever. The key is to be one step ahead of them if you want to be able to fulfill their needs.
When consumers search for a product online, they most likely look for the following types of information:
- Price of the item at the nearest store
- Details about local stores (opening hours and contact details)
- Availability of stock at the nearest store locations
- Directions to the nearest store that carries the product
- Other related products available in nearby stores
Accordingly, you should have that information presented in your ads, in content that appears on organic search results, and on your website, too.
Why the Google Shopping Insights Tool Is Helpful
It's helpful in...
- Measuring consumer interest in a product at country, state, region, and city level
- Comparing product demand across different geographic areas
- Getting information on mobile and desktop use, to plan your campaigns accordingly
- Comparing product demand during different shopping seasons
You can search for your products, and the tool will offer insights about your customers, such as where they are, what devices they use, and other important information. (Access Google Insights here.)
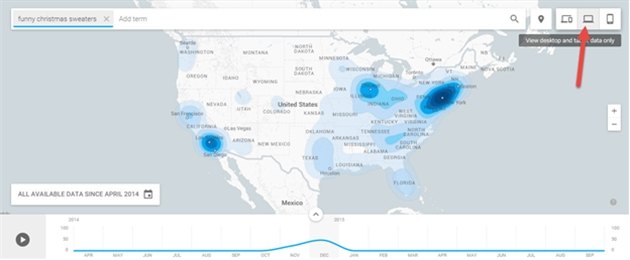
For example, if you are selling Christmas sweaters, a search for 'Funny Christmas Sweaters' can show you a heatmap of the areas where your customers are searching for that term:
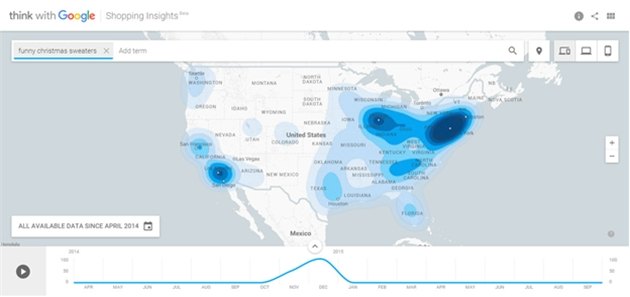
Now you know what locations to focus on in your marketing campaigns. As you can see, the state of New York has the most interest in funny Christmas sweaters. Therefore, it makes more sense to invest more budget targeting this area than Montana or Idaho.
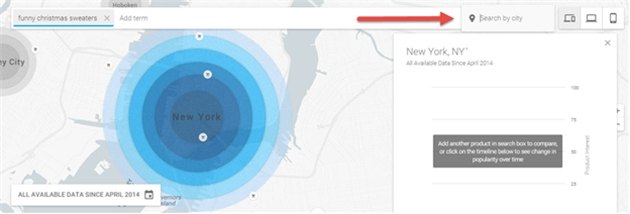
You can also search by city—for example, New York—and now you can view the heatmap at a city level:
Another interesting feature is the ability to see how customer interest changes over time in the graph:
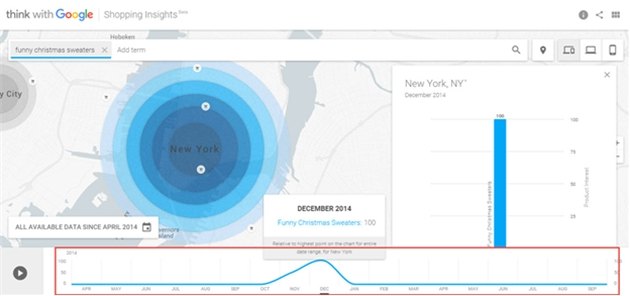
You can see product interest month over month. In this case, from January until October the trend is straight. However, in November and December the trend goes up because, after all, the product is in season during those months.
You can also click on the "Play" button on the left side to run a slide show that will show month-over-month interest. You don't have to click on the line to view each month individually.
Desktop and Mobile Insights
Another interesting feature of this tool is the capacity to let you view what devices your customers use so you can plan your budget for desktop and mobile accordingly.
To view nothing but desktop insights, you can click on the desktop icon on the right side:
And to view the mobile insights, click on the Mobile icon right beside the desktop icon:
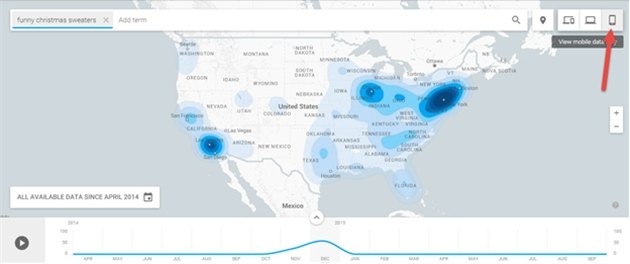
You can compare desktop versus mobile for marketing ideas. Most customers now choose to go mobile as they start their shopping, wo you will find the mobile heatmap more visible than the desktop heat map. Of course, there are still some industries where you will find desktop searches more prominent than mobile searches.
Compare Customer Interest Over Different Shopping Seasons
This tool also gives you the option to compare different shopping seasons to see how consumer interests change over time.
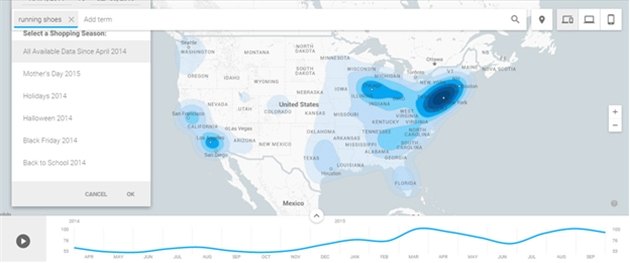
You can compare Mother's Day, the yearend holidays, Halloween, Black Friday, and the months when kids go back to school.
If we use "running shoes" as our sample product, you can see a boost in interest during the back-to-school season and the holidays; however, on Black Friday and Halloween, you will see significantly less interest:
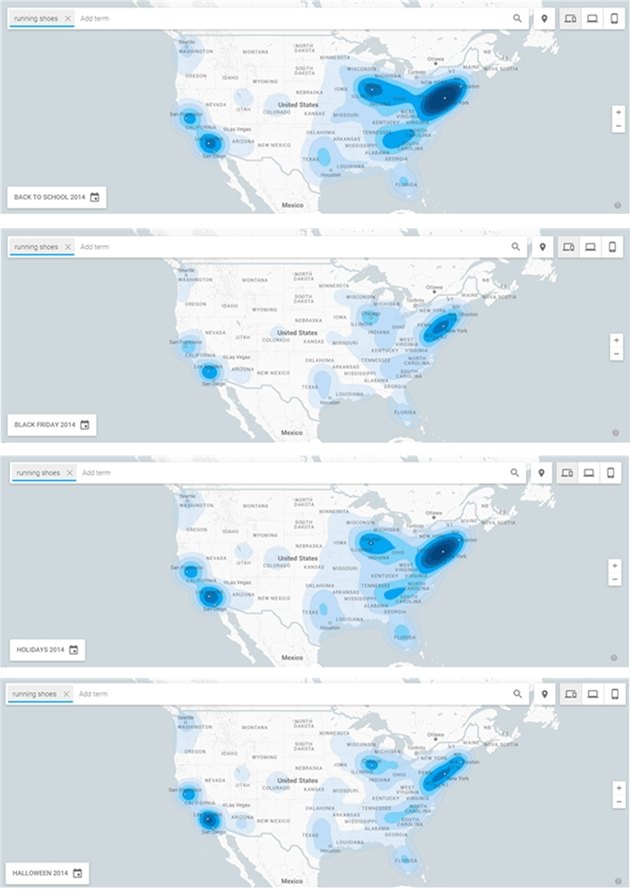
This type of information gives you an idea of how much you should prepare for upcoming seasons and what season will likely prove the most important for your business.
PPC Tips for Retailers
Since this tool is specially designed for retailers, here are some tips about how you should manage your PPC campaigns for maximum ROI:
- Optimize your PPC campaign in the areas where you have stores. Spend most of your budget around your local store, and use location Extension to give users directions to your nearest store.
- If most of your customers search for you through mobile, make sure you remain in the top positions no matter how much that costs you. It can be expensive to maintain those positions, but there are also more chances of conversion. Because they are searching near your store, there is a huge chance they will visit you while they're on the go.
- Set up shopping campaigns to promote your in-store inventory through Google Shopping campaigns. When users search for a product you have in one of your local stores, they will see your ad with details about the nearest store. The user will then have the option to see store directions instead of having to look for it on the website. This then becomes a great way to increase in-store sales. (Find out more about how these amazing shopping ads work.)
- Run promotions at your local store to encourage users to pay you a visit. You can run ads to promote your local promotions to those customers who are searching for your product around the local store. "Get 30% off at Your Nearest Store" or "Offer Ending Soon. Visit Now!" are the types of ad that will draw foot traffic.
- Give your customers the option to place an order online through your website and pick it up from the nearest store that has that product in stock. This can be achieved if you are using Omni-channel technology to manage your inventory.
A final note: if you find that in a city where you don't have a physical store there is a huge demand of your products and you are getting online orders from those cities, then you should consider opening an outlet in that city, because a huge percentage of customers still prefer to buy from the actual store after seeing a product online.