.svg "quintly-logo (1)")
In our Instagram study for 2015 we analyzed the development of the interaction rate and found a downwards trend by almost 40%. Due to the fact that this rate takes more values into consideration (to make profiles comparable, irrespectively of size) the decreasing rate has more than one factor. To get a better understanding of how that affects total interactions, we used this Instagram study to also analyze purely likes and comments.
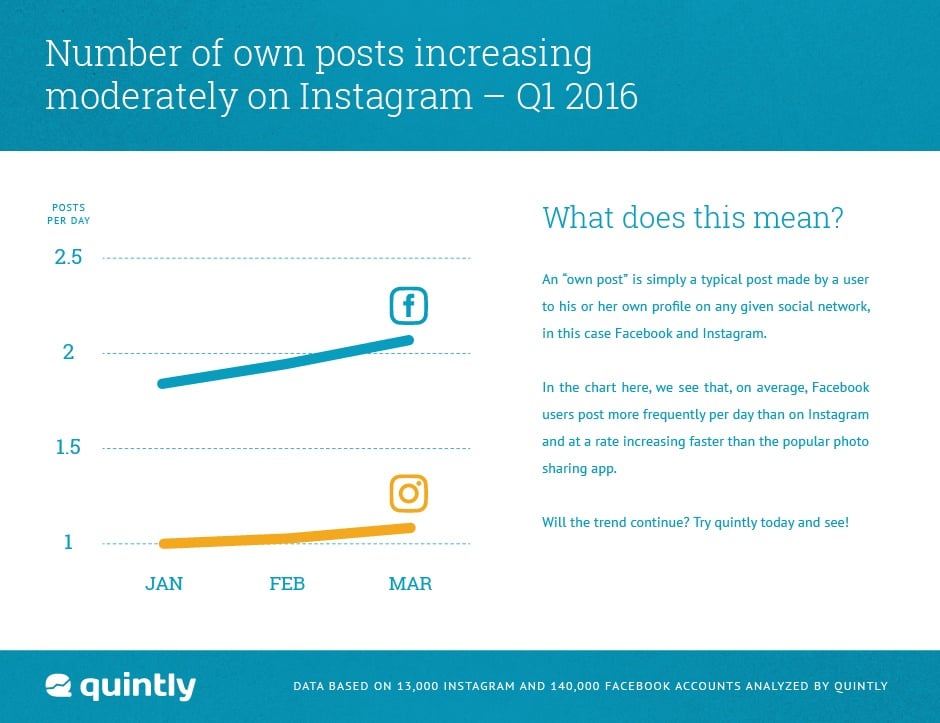
Over the last years, Instagram became one of these “homescreen apps” that the average user checks more than once per day. The frequent use and rising number of users made the network highly interesting for businesses. During 2015, companies slightly increased their own posts on Instagram, from daily 0.89 to 1.04 posts between January and December 2015. This moderate increase continued in the first quarter of 2016. Comparing Instagram data to Facebook data makes it always easier to understand by analyzing a mature benchmark with “normalized” interaction rates and expectedly lower growth rates.
Timelines get increasingly crowded
Analyzing the own posts of both networks in Q1 ‘16, Facebook surprises with a significantly stronger increase of posts during the first three months. Even though Facebook is supposed to be saturated already, businesses still seem to rely heavily on the mother of all social media networks. Having said that, they do not only “continue to rely” but they invest more and more in Facebook.
Before taking a look at the interactions these posts received we digged deeper into our Instagram analysis by identifying the share of posted content. One year ago we detected that video posts were roughly five percent of Instagram timelines, whereas one year later videos are more than 15 percent. The ten percent point increase reflects that video content gets increasingly attractive and businesses try to benefit from the emotions they are able to communicate in a video. Over the last year many brands on Instagram surprised their followers with creative ideas and as a result the content performed well. As a result, Instagram videos now seem to play a crucial role in companies storytelling approaches.
Total amount of interactions on a steep drop
Now, we analyzed the developments of own posts and the share of own posts, identifying that videos get increasingly important. Knowing that is an important foundation for effective Instagram marketing. In our last Instagram study we reported a decreasing interaction rate but in this analysis we wanted to have a closer look solely at interactions. Thus, we compared the absolute number of interactions in groups with differently sized profiles. Even though we commented in our last Instagram study that decreasing interactions are a normal phenomenon on a “not yet saturated” network the number revealed are surprising.
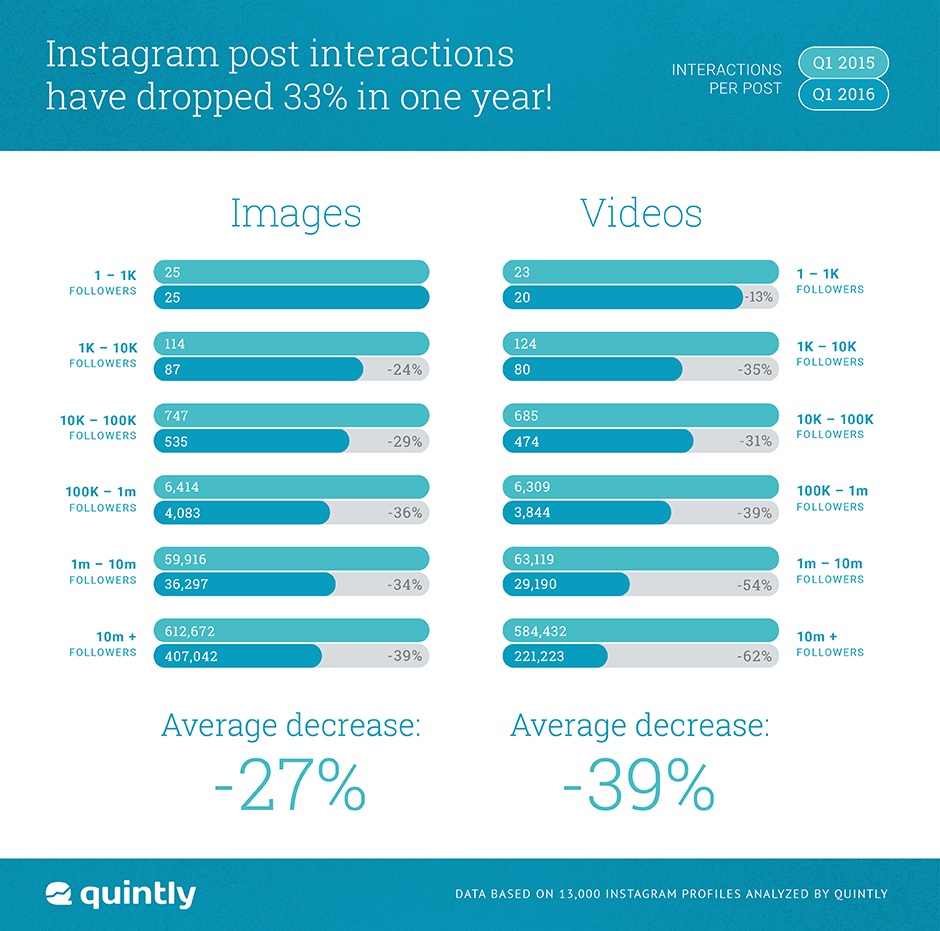
The decrease in total interactions - especially in bigger sized profile groups - is tremendous. In the smallest analyzed profile cluster (1-1k followers) the amount of image interactions remained the same but in this profile bucket we should not expect a high number of brands but more private profiles. In bigger profile clusters such as over 100k followers the amount of total interactions dropped by 36% and even more in the biggest profiles analyzed (10m+ followers). What do these numbers mean for the network itself and marketing on it?
To answer that question we first need to think of potential reasons. The first and most obvious one is that with a growing user base and constantly increasing post frequencies the individual user has more content in his or her timeline but is not necessarily eager to interact more as he did one year ago. Thus, the average interaction on each post decreases. A second potential reason could be, with more brands joining Instagram and the possibility to advertise, users could be alienated, which results in less interactions as well.
These assumptions could be an indicator for brands that advertising on Instagram needs to be as authentic as possible. A solution therefore could be to post content that is perceived as it would have been posted by a “good friend”. As described before, interactions in small profile clusters, that are assumed to be more private relationships, decreased significantly less than big Instagram profiles. Through this approach brands can try to be perceived in a more positive way as a business normally is.
Having said all that, interactions decreased massively on Instagram but are still higher compared to Twitter or Facebook. The takeaway should definitely not be that Instagram is losing traction but more that it starts to get harder to achieve success in the “fight for interactions” on increasingly fast timelines. In the study you are able to access above for free you will find all numbers split up in differently sized profile groups to make it applicable for every businesses active on Instagram.
If you have any comments, just join the discussion below. In case of any questions, we are just one tweet away.


Join the conversation. Leave us a comment below!