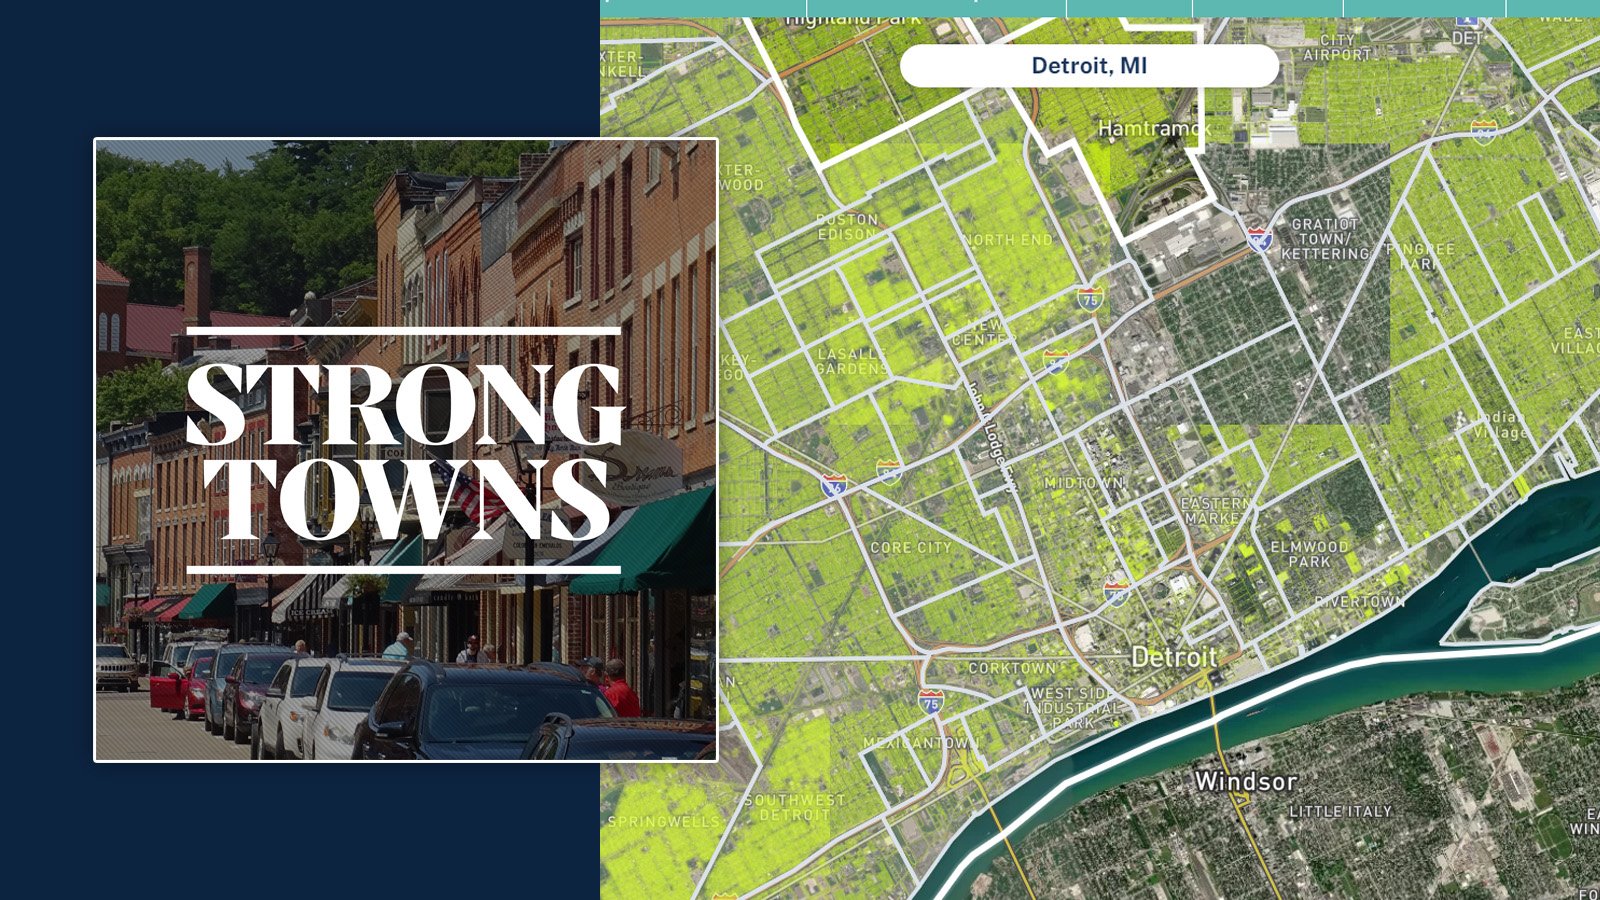
Podcast: Nitin Gadia with a new Mapping Tool

Photo of Nitin, from LinkedIn
Are your taxes paying for the cost of your street? Inspired by Strong Towns, Nitin Gadia has created an interactive mapping tool to explore the answer to this question in his hometown of Ames, Iowa. Nitin works for MapStory, an open platform for organizing our knowledge about how the world changes over time and space. This is one of his many projects.
We interviewed him for the Strong Towns podcast (scroll to the bottom of this post for that). First, let's start with the map:
You can explore it on this page, or, for a larger, more thorough version, visit Nitin's website.
The map compares property taxes with the cost of the streets abutting each property. You can hover over each plot of land and read exactly what its property taxes and street maintenance costs are, in addition to the ratio of one to the other. The color coding of the map shows red properties covering little of their maintenance costs, and green & blue properties covering 100+% of their costs. Unsurprisingly, the map is a sea of red.
Of particular note is the downtown, which you can locate by zooming into the middle. You'll see "Main Street" just north of the highway. It stands out for two reasons:
- The plots of land are much smaller than in the rest of the city. These are modest storefronts, most a few stories tall, occupied by nearly 100% local businesses.
- Almost every property appears green or orange on the map, meaning they're covering all or most of their maintenance costs through property tax revenue.
Nitin created this map with data from his city government, as well as the input of a civil engineer, which he used to calculate average street maintenance costs for each property. He also accounted for citywide costs in his calculations.
You can read more about his process here, and even read the technical documentation on how he created this map.
Listen to the Podcast:
+ Podcast transcript
Rachel Quednau, StrongTowns: Hi everyone and welcome to the Strong Towns podcast. Our guest today, whom I'll bring on in just a moment, is Nitin Gadia. He created a fantastic mapping tool that examines whether property tax revenue is covering the cost of street maintenance for every property in his hometown of Ames Iowa.
Before we get started, I want to encourage you to visit our website where and you'll find this map. Just go to strongtowns.org/podcast and you'll see a link to this post about Nitin Gadia. If you can view it on a desktop or laptop computer versus a phone, that's ideal because this map really gets into the details.
You can mouse over every property in this city and see what percentages of the street maintenance cost are covered by property tax. Spoiler alert, most of these are in the red. Actually the whole map is organized by color and you'll see that a lot of it is in the red. A lot of the properties are not really covering their maintenance costs.
Next week, we'll share more on our website about how Nitin created this map and also how you can go about making one for your own city. We'll get right to the podcast now. Take a look at that map when you have a chance.
Rachel: Hi everyone, welcome to the Strong Towns podcast. This is Rachel Quednau, Communication Specialist for Strong Towns. I have on the line, our guest Nitin Gadia who created a really cool mapping tool and sent it our way a couple of weeks ago. We thought we'd bring him on here to talk about it and we'll be sharing it on our website this week.
First of all, can you just tell me a little bit about your background? Welcome to the podcast.
Nitin Gadia: Thank you for having me. Some people occasionally ask me what my background is. I guess, I don't know really how to answer that. I'm self‑taught. I work with an organization called MapStory, which is like a Wikipedia for mapping. That's how I'd put it. I develop content for website. This is an example of something that I developed.
Rachel: You live in Ames, Iowa, right?
Nitin: Yeah, primarily.
Rachel: Can you walk me through this map? Like I said, we'll post it on the website so that everyone can view it. This is an analysis of property taxes and costs of streets in Ames, Iowa.You ask the question here, "Are your taxes paying for the cost of your street?" Unsurprisingly, for our Strong Towns audience, most taxes are not paying for the cost of most streets. How did you create this map, and how did you get the idea for it?
Nitin: I got the idea from you guys partly. I was at a mapping conference and somebody told me about Strong Towns, somebody in Portland. I was at a mapping conference there and that got me interested. I'm very interested in city planning, so to speak, urban design in general. I looked up Strong Towns and Chuck Marohn. I read the articles on the Growth Ponzi Scheme, it really blew me away.
My dad had always said, growing up, "There's no way we're paying for these roads. We're not going to be . . . " He has this insight that very few people have. I finally was able to actually show that very discreetly. How much we're paying for our roads, and how much it actually costs.
What I did for this map is . . . it's a heat map, which means that every property is colored by the percentage of its actual cost. In the case of my parent's property in Ames, they're paying maybe 30 percent of the cost of the street. You can actually roll over the property and see that.
Rachel: How did you get the data to put this all together?
Nitin: I work with people at the City of Ames to get data. Ben McConville, he's the GIS coordinator at the City of Ames, which basically means that he deals with mapping. I always just call him up and ask him for some data, and he sends it to me within a few minutes.
The other half of the data, I got from a civil engineer. I walked up to the public works desk in the City of Ames. The City of Ames is great, because it's small enough that you can approach people directly. I asked him, “This is what I'm looking for, an average cost of what roads cost, how long it takes for them to be requiring resurfacing.” He gave me some average numbers.
A lot of people will jump up and down and scream and shout “the cost of roads varies a lot.” It really doesn't vary that much. I really like to think of 80/20 rules. If 80 percent of the streets cost a certain amount of money, 20 percent of them don't deviate that much. I went around online a little bit. It looked like his numbers were pretty accurate.
Rachel: The city was willing to give this information to you as publicly available. Did you tell them what you're going to do with it?
Nitin: I'm trying to figure out how to approach city government. Recently, I asked for a budget of how much parking costs in Ames -- a public parking budget. They refused to give it to me. It was really strange. The city accountant was basically like, “You don't know how software works. We can't just give you numbers.” It was very hard for me to believe.
I get data from all over the world. For MapStory, I did a nationwide assessment of parcel data, which means that I tried to get parcel data from every city in every state.
What I found is that whenever you want to get data from a city, you have to think about the right person to ask and ask that person. If you ask anybody higher up, they're going to spin their wheels. They're going to spend literally hours sometimes giving you nothing, and then complain that you're wasting their time.
This information, I mean, that the civil engineer gave me, I'm guessing it took him under a half an hour to throw some numbers together and send them to me. Within 20 percent what they are, that's all that I needed to know.
Rachel: Do you have plans to -- have you shared this map with anyone in your area, or with the government, or are you still fine tuning it?
Nitin: I sent it to that civil engineer. That's it. I did post it on my own Facebook page. I was wanting to prepare a little bit more before putting it out. Now that this podcast is happening . . . I have a mapping blog. I'm going to probably put some information about how I made this map.
Rachel: I'm sure people would be curious. Do you have a platform that you use, I'm assuming, to create this?
Nitin: Yeah. I used a regular mapping software. If you need a free software, there's Quantum’s. It's called QGIS. If you wanted to pay good money, there's ArcMap, which is like Microsoft Word or Office of mapping software.
Rachel: Good to know. I'll describe this really quick for people listening. Basically, this is a map of City of Ames. You've color-coded it so that the red dots and things on the red side of the color spectrum are properties that are covering very little of their street cost.
Then, when we get to green and blue, those are properties that are covering either 100 percent or even more than the cost of the street.
I'm surprised with this map is almost completely red. Do you think that would shock people?
Nitin: Definitely.
Rachel: Do you think that people realize that?
Nitin: I was pretty shocked myself. I thought that this was a problem. I would've thought it was more of a problem out in the ‘burbs. It’s a problem everywhere, even in Ames.
Ames is lucky. We're a small town, about 60,000 people. It has a campus. It's one of the few cities in America that has a huge university and it's an isolated town. It has the highest per capita college degrees in the world -- top five.
It's funny, I put this out and a lot of people might be like, “Oh well, those small town dumb Iowans don't know what they're doing,” but I can assure you, everybody in Ames is . . . The bus drivers are all getting their PhDs. It’s tough. Everybody's pretty well educated. Nobody knows this is happening. I thought it was happening further out in the 'burbs.
What I was going to say about Ames is that it's a small town. I found in doing maps for that, after a city gets a certain size, its downtown gets gutted. Its older areas get destroyed. Des Moines, only an hour away from us, very few of its buildings downtown are intact, whereas in Ames, we have a huge main street. Literally 100 percent of the businesses are local in this. Pretty similar -- maybe 50 percent -- in our Campustown
Rachel: Are those buildings some of the original buildings in the downtown?
Nitin: Yeah, almost all of them.
Rachel: I was trying to figure out on this map -- because I've never been to Ames -- which part of it is the downtown. Most of it is pretty red. Do you see in the map that the downtown is more financially solvent with property taxes? Is that the case in this or not?
Nitin: I actually did a 3D map as well that shows each property based on the taxes per square foot. What that showed was that astronomically, the older parts of town -- the downtown, Campustown, and there’s actually a new urbanist community in Ames. Those three communities are providing far more per value per square foot than any other part in Ames by orders of magnitude. The only parts that came out green were the downtown and Campustown. Ames is kind of two cities. There's downtown and there's Campustown. They started separate and they grew into each other.
Rachel: I'm looking here at the Main Street, and I'm noticing, like you said, a lot more of this is green and solvent. Also, the plots are a lot smaller. Small downtown businesses, I'm assuming?
Nitin: Yeah, they're all attached buildings, just like in the good old days. They actually shared walls. I live on Main Street there as well. It's amazing how many people, they're surprised that I live downtown. There are so few apartments on the second floors because that's just the policy that my city and every other city has engaged in – just basically letting their downtowns where people really want to live [be idle] . . . . Thousands of people in Ames want to live downtown, but there's nowhere to live. There's minimum parking requirements. There's all sorts of issues that prevent people from even being financially able to repair their buildings and bring them up to par.
Rachel: I was definitely going to ask about the parking requirements. What are those like, if you're familiar? What are they like in Ames?
Nitin: That's something that I'm going to be trying to work towards reforming -- help towards that. It's nuts. In a town where 35,000 people are students, they require every property to have one parking spot per bed.
Rachel: Oh my gosh. That is really absurd.
Nitin: It's bizarre. I'm trying to help turn our Campustown into a pedestrian area. It’s basically filled with parking. Constantly, half the businesses don't think that there's a problem with parking. The other half think that there's a huge problem. It's a constant issue in Ames.
Rachel: Do they think there’s a problem with not having enough parking?
Nitin: Yeah. But you know, it’s just a management problem. I've been following the work of Dr. Donald Shoup at UCLA. He shows how if you go around downtown in Campustown in Ames, there is a glut of parking. This is an incredible story.
In Campustown in Ames, a few years ago, they built what was called an Intermodal Facility. It’s kind of a parking garage. It was for our local buses Cyride. It would be like a center point. The shuttles that go to the airport, they all go through there. It's this big parking garage. To this day, that parking garage, it doesn't have signs. It doesn't have signs that say, “Public Parking.”
This is a multimillion dollar facility that was paid for, lo and behold, by the federal government. The city tends to think that this is free, [but this is] liability that is enormous.
I asked the City of Ames, “Whose liability is this when repairs need to be done?” They literally don't even know. They don't even know whose liability it is. They haven’t worked out between Iowa State and the City of Ames who is going to pay for it.
Rachel: When was this built?
Nitin: A few years ago -- maybe 2011, 2012. I'm not sure.
Rachel: They haven’t had to deal with it yet, but they will soon.
Nitin: It’s a part of the stimulus money. It’s a huge misapplication of resources by the federal government.
Rachel: Stimulus money for a parking garage? That's depressing.
Nitin: In theory, it could've been good. It's good to have parking garages rather than flat parking space. That could take cars off the streets and out of the parking lots. Then, we could grasp those parking lots. That would be much better.
Rachel: That's true.
Nitin: In theory, it could've been good. It’s bizarre. It’s empty. It sat empty for years and years. The City of Ames even got approved signs to be put up. The city still hasn't put signs that say, “Public Parking” and way finding signs. The whole thing is really difficult to use.
Nobody knows that it's available to be used. You can go on the busiest day in Iowa -- an Iowa vs. Iowa State game -- and people are circling around looking for parking. That parking garage is empty because nobody knows that they can use it to park.
Rachel: What a waste.
Nitin: This is what the City of Ames is, and every city in America practically, is doing with our finances.
Rachel: So we talked about the downtown here. Do you have an edge district with big box stores and that type of thing? What does that look like on the map?
Nitin: It's interesting. It turned out that those areas were super positive in many ways, which I was a little bit surprised about. However, there is an industrial park, which is a third of the square footage of Ames. That's a mix, but it's mostly negative.
Rachel: When you're thinking about a large plot of land, it has far less streets occupying that area versus a really tightly built area. That might play in also. I don't know.
Nitin: I'm sorry. Play into what?
Rachel: That might play into the fact that their ratio of taxes to street maintenance costs is higher because they don't have to pay for so many streets to be maintained. Does that make sense?
Nitin: Yeah. That’s the thing.
Rachel: They had one huge street around their massive parking lot and store.
Nitin: I'm doing another project where I’m trying to gather all the money that is being given by Campustown in Ames to the city, and all that they're getting, meaning all that they're generating in revenue, and taxes, and property taxes, and sales taxes.
The amount of money they're getting to repair the infrastructure, maintain the infrastructure in Campustown, and police the area, and do all these different things. So far, what I've found, I'm guessing that -- this is not an official number yet -- Campustown is probably providing at least five times the amount that they're getting from the City of Ames.
What’s funny is that the City of Ames is two separate areas. The city government exists in the downtown. The Campustown is like this peripheral part of town, which provides by far the most revenue to Ames in terms of the bang for buck.
It shows where our priorities are in cities. The areas that are really providing the most [tax revenue] are being not only neglected, they're basically being treated like colonies. Their wealth is being extracted and spread out across town to all the places that people don't care about -- our strip malls.
Rachel: Do you have a fair amount of suburban type developments in your city?
Nitin: People would laugh when I say that I grew up in a suburb because Ames is the size of a typical suburb in a major metropolitan area. The area that I grew up in, it was a subdivision. I should say that's a suburban type subdivision. It's a middle, upper middle class, upper class, all big mansions type.
Rachel: Cul-de-sacs.
Nitin: Cul-de-sacs, exactly. Right next to it, in return for being able to build that -- that's from what I understand -- they build a new urbanist community. They're screwing it up quite a bit, actually. The book "Suburban Nation" mentions this development that they did, and what went wrong with it.
Rachel: It's still around?
Nitin: Yeah. It’s thriving in my opinion. It's a third main street area. It has very high property values. It’s full of businesses. Some of our best restaurants are there. It’s full of a mix of housing. It feels more like a neighborhood. They still screwed up a lot of things. They made this road that goes through the middle of it, it was two lanes. Then, they turned it into four lanes. It’s full of accidents. It guts the whole concept. In many ways, it’s very successful.
Rachel: You mentioned those mapping tools, but I know that you yourself have a background in mapping. How feasible do you think it would be for somebody -- a layperson -- to create this type of map for their city if they were able to access the data? Didn't this take a lot of coding work?
Nitin: I am going to document how I did this. I could maybe make a short video about how I did it -- just an overview. It did take a lot of manual labor. There are some cities that might have data that could be readily used.
To create this map, I had to find what was the frontage of each property, meaning, “What is the length of street in front of each house?” In order to do that, it took a lot of technical work and trial and error.
Rachel: I can see how that would take a long . . . .
Nitin: Some cities might have that kind of data on hand, like “What is the street frontage? What is the length?” They might actually have that in the data. You never know.
Rachel: What other kinds of maps have you created? I'm curious.
Nitin: I mainly make animated maps. They show change over time. I did one of Ames growing from the time it was founded. That's a pilot project of what’s called “MapStory Local.” MapStory Local, the idea is that you can type in a year and you can see the way the world was then. Then, you can animate it back and forth.
Rachel: Cool. What kind of things do you look at in that? Is that a photograph? Is that the streets and the rivers and stuff like that? What is that showing?
Nitin: The buildings, roads, railroads, parcels, meaning properties. Usually I start with a date that the existing buildings were built, and then that gives you a close approximation, because America's pretty young. Most cities, you can just pretty much animate 80 percent of it right away.
To go back further in time, you have to take old maps, and you have to spread them over. You have to draw over them in this digital surface. It’ll all be crowd-sourced, like Wikipedia. Everybody’ll be editing this global history. All the basic components will be done this year. It’ll be a pretty big deal -- the website -- if all goes well.
And other than cities, I also do biodiversity, genealogy -- I just came back from a genealogy conference -- and pretty much everything. I'm driving to developing content when MapStory gets going.
Rachel: I'll have to keep track of that and keep checking in to see how that's progressing. Do you have anything else that you want to add about this?
Nitin: I'm sure this will be written about when people go to the website. The way that I made this map is [this]: I started with what was in front of people’s properties. The thing is, is that there are a lot of shared costs -- for example, intersections, that aren't in front of anybody's property, or streets that are a part of larger communities that connect properties. What I did was I have two things in the map. I have just what’s in front of people's houses and properties, and I also added shared costs. That's what took a lot of time.
Rachel: I can imagine.
Nitin: I took the costs. First, I did the circles. Then I did the intersections. Then, I did citywide shared costs.
Rachel: Does that last one, does that account for highways and other public roadways?
Nitin: No. I only focused on our local finances. This is something I should also mention. It’s interesting, a lot of people I talk to, even in the City of Ames, they think that our streets are paid for by the gas tax or something. That's not true. 98 percent of our roads are local. They are all paid for by property taxes.
More specifically, they're paid for by bonds, which are paid back by property taxes. I excluded anything that wasn't local, which was only two percent of the roads, anyway.
Rachel: You can view, on this map, just the roads directly around a house? And also you can view it with the shared costs?
Nitin: Yes, in the upper right, there's these buttons -- front lane only or you can add the shared cost.
Rachel: There's some land that's blank -- white on here. Was that the data you weren't able to find it or are those parks?
Nitin: That's all government property. The big white area in the middle, that's Iowa State University. There's a lot of government property in Ames.
Rachel: Yeah, I'll say.
Nitin: That is interesting. You're used to that living in Ames. More than half of Ames is Iowa State.
Rachel: Thank you so much for sharing this map, for creating this, and for talking to me today. I will put this on the website and links to your stuff. Thank you so much for participating. I'm excited to see what other work you create with your projects.
Nitin: It was a privilege. Thank you so much.
(Top image from Nitin Gadia)