
Abstract
Permafrost soils store over half of global soil carbon (C), and northern frozen peatlands store about 10% of global permafrost C. With thaw, inundation of high latitude lowland peatlands typically increases the surface-atmosphere flux of methane (CH4), a potent greenhouse gas. To examine the effects of lowland permafrost thaw over millennial timescales, we measured carbon dioxide (CO2) and CH4 exchange along sites that constitute a ∼1000 yr thaw chronosequence of thermokarst collapse bogs and adjacent fen locations at Innoko Flats Wildlife Refuge in western Alaska. Peak CH4 exchange in July (123 ± 71 mg CH4–C m−2 d−1) was observed in features that have been thawed for 30 to 70 (<100) yr, where soils were warmer than at more recently thawed sites (14 to 21 yr; emitting 1.37 ± 0.67 mg CH4–C m−2 d−1 in July) and had shallower water tables than at older sites (200 to 1400 yr; emitting 6.55 ± 2.23 mg CH4–C m−2 d−1 in July). Carbon lost via CH4 efflux during the growing season at these intermediate age sites was 8% of uptake by net ecosystem exchange. Our results provide evidence that CH4 emissions following lowland permafrost thaw are enhanced over decadal time scales, but limited over millennia. Over larger spatial scales, adjacent fen systems may contribute sustained CH4 emission, CO2 uptake, and DOC export. We argue that over timescales of decades to centuries, thaw features in high-latitude lowland peatlands, particularly those developed on poorly drained mineral substrates, are a key locus of elevated CH4 emission to the atmosphere that must be considered for a complete understanding of high latitude CH4 dynamics.
Export citation and abstract BibTeX RIS

Content from this work may be used under the terms of the Creative Commons Attribution 3.0 licence. Any further distribution of this work must maintain attribution to the author(s) and the title of the work, journal citation and DOI.
1. Introduction
Over half of global belowground carbon (C) is stored in permafrost soils, largely at high latitudes where rates of climate warming are greatest (Yu 2012, Tarnocai et al 2009, Kuhry et al 2013). Permafrost soils and in particular northern peatlands have acted as sinks for atmospheric C since at least the late Pleistocene, and perhaps the last interglacial period (Reyes et al 2010). They are now subject to increased thaw and potential C release with climate warming (Grosse et al 2011, O'Donnell et al 2010 2011a, Halsey and Vitt 1995). As the area of near-surface permafrost in Arctic and boreal systems has decreased steadily over the past 100 years (Lawrence et al 2008b), C release has arguably been limited by resiliency of these systems against thaw cycles (Camill et al 2001, Jorgenson et al 2013), but a continued decrease in permafrost area—estimated as at least 30% by 2100 (Lawrence et al 2012, Slater and Lawrence 2013)—is likely to release large amounts of stored C as a positive feedback to atmospheric warming (Grosse et al 2011, Lawrence et al 2008a, Schuur et al 2008, Elberling et al 2013).
It is well established that as thawing peatlands are warmed and inundated, methane (CH4) release becomes an important pathway of C loss (Frolking et al 2011, Jorgenson et al 2013, Schuur et al 2008, Turetsky et al 2002, 2007 Wickland et al 2006, Christensen 2004, Bäckstrand et al 2010, Malmer et al 2005). This is of concern because estimates suggest that northern peatlands currently contribute ∼3–9% (15–50 Tg yr−1) of global CH4 emissions, and atmospheric CH4 is a strong contributor to global radiative forcing (Kirschke et al 2013, McGuire et al 2010, Wofsy et al 2007, Dlugokencky et al 2011). It is well known that methane emissions respond to soil temperature and soil moisture, which together with plant community composition explain >60% of the variance in CH4 flux in high-latitude wetlands (Olefeldt et al 2012).
Recent work has also shown that outcomes of permafrost thaw—including CH4 efflux—depend on landscape context, which determines thaw-induced change in hydrologic processes, plant species assemblages, and thermal regimes (Camill et al 2001, Grosse et al 2011, Jorgenson et al 2013, Harden et al 2012). These changes in turn alter the availability of belowground C stores to microbial metabolism (Jones et al 2013, O'Donnell et al 2011a), and the balance of subsequent carbon dioxide (CO2) and CH4 flux—a fundamental relationship for predicting the climate effects of permafrost thaw (Frolking et al 2011). Both CO2 uptake and the shorter lifetime of CH4 in the atmosphere counteract the stronger radiative forcing of CH4, often suggesting a net cooling effect of northern peatlands (Frolking et al 2006, Wickland et al 2006). Moreover, the effects of permafrost thaw on these fluxes must be considered as a persistent perturbation to ongoing emissions—rather than a one-time release—that arises from changes in the distribution and thermal state of peatlands over time (Frolking et al 2006). Over longer timescales, the landscape context and feedback processes that favor development or degradation of permafrost peatlands must be considered in order to predict thaw trajectories (Harden et al 2012).
Here we quantify CH4 and CO2 exchange in a chronosequence of thermokarst bogs and in an adjacent fen system, developed within a degrading peatland in west-central Alaska, in which peat accumulated following extensive thaw lake development in yedoma (ice rich eolian silt) >3000–8000 14C yr BP (Kanevskiy et al 2014) and is now undergoing widespread permafrost thaw. This sequence of events is consistent with evidence of thaw-lake development following the last glacial maximum that has been observed across eastern Siberia and Alaska, and subsequent peat accumulation in the early Holocene, followed by permafrost accumulation in ice-rich peat plateaus with cooling during the middle Holocene (Kanevskiy et al 2014, Jones and Yu 2010, Macdonald et al 2006, Walter et al 2007, Reyes and Cooke 2011, Hunt et al 2013). Due to their high ice content, these locations are now subject to dramatic physical collapse upon thaw, with poor drainage due to the underlying reworked silts (Kanevskiy et al 2014, Jorgenson et al 2013).
We hypothesized that in these environments, high CH4 emissions will lead to positive radiative forcing with permafrost thaw (Frolking et al 2011, Olefeldt et al 2012). It has been demonstrated that thaw trajectories in Arctic peatland environments influence C storage when they progress over timescales of centuries to millennia (O'Donnell et al 2011a). Therefore, we sought to explicitly link measured CH4 exchange with an age-constrained thaw sequence representing this timeframe of thaw progression. We evaluated CH4 exchange in the context of increased CO2 uptake, total C stocks, and the physical collapse, inundation, and plant community succession that accompanies thaw trajectories in lowland settings over these timescales.
2. Methods
2.1. Study area
We conducted our study within the Innoko Flats National Wildlife Refuge (NWR; 63.58 °N, 157.72 °W; figure 1), in the extensive lowlands developed on eolian and lacustrine silts south of the Innoko River, an area of degrading peatlands with a continental subarctic climate (USFWS 1987, Woodward and Beever 2011). Innoko Flats is the fifth largest NWR in the United States with an area of 15 582 km2 and no road access. Over half the refuge is wetlands and much of the area is underlain by permafrost (USDOI 1987, Woodward and Beever 2011). Innoko Flats has a mean daily temperature of −17 °C in January and +14 °C in July (1993–2007; Woodward and Beever 2011), and mean annual precipitation in this region is 445 mm yr−1 (1971–2000; Riordan et al 2006). The snow depth in April 2011 was 0.60 ± 0.09 m across 18 locations, consistent with previous observations for the refuge (Woodward and Beever 2011). The initiation age of the terrestrial peat deposit at Innoko Flats is estimated to be ∼2000–3000 14C yr BP (Kanevskiy et al 2014).

Figure 1. Map of the Innoko National Wildlife Refuge (63.58 °N, 157.72 °W) denoting the position of study area within the refuge (top). Aerial photograph of Innoko study area showing location of each site. The area of the photograph is approximately 24% frozen, 39% bog, 26% fen, and 11% open water, based on interpretation using a grid overlay.
Download figure:
Standard image High-resolution image2.2. Study design
To capture thaw dynamics of lowland permafrost over millennial timescales, we evaluated trace gas fluxes, C stocks, temperature, inundation, and topographic effects across a thaw chronosequence of thermokarst bogs and an adjacent fen system (figure 1). A thaw chronosequence is a series of locations in which factors such as climate, potential vegetation, parent material, and landscape context are similar, but time since thaw differs. Four landscape units (site types) differing in thaw stage were identified based on landscape position and vegetation: forested plateaus where previous thaw has yet to cause a community shift, and ombrotrophic bogs at three stages of thaw, hypothesized to be young, intermediate, and old. An adjacent minerotrophic fen system was also evaluated, and is distinct from the bog chronosequence due to active water flow. Three field replicates of each landscape unit (site type) were identified based on vegetation and feature size, for a total of 15 measurement locations. All three old bog sites were within ∼10 m of collapse boundaries, where boundary elevations indicated 1–3 m of lowering of the peat surface, consistent with thawing of high ice content, and where forest-bog peat transitions were evident in cores (Jorgenson et al 2013).
2.3. Site characterization
In September 2009, core samples were collected at all sites for stratigraphy, carbon inventory, ice content and isotopic analysis (Kanevskiy et al 2014). Unfrozen organic soil was sampled using a variety of soil knives, scissors and corers, in order to obtain a sample of known volume. A SIPRE (Snow, Ice and Permafrost Research Establishment) corer was used to sample the frozen peat and underlying lacustrine and eolian silt. Peat core sections were analyzed for C concentration by combustion (Carlo Erba NA 1500) following oven drying (105 °C) and milling. In September 2010, boardwalks were constructed and placed at each site to minimize disturbance to the sample locations, and 37.5 cm diameter PVC collars were placed into the ground at the end of each boardwalk to a depth of ∼15 cm. The collars were placed in the plateau and bog locations in September 2010, eight months before initial flux measurements were taken. Collars were placed in the fen locations in May 2011, a few days before initial flux measurements at those locations.
Soil temperature at 5 and 25 cm depth was measured using thermistors and Hobo Pro V2 loggers (Onset Computer, Bourne, MA), in all feature types, from September 2009 to September 2011 but with gaps due to bear damage of loggers. Rainfall was measured from April to October 2011 using a tipping bucket and Hobo Pendant data logger (Onset Computer). Water table position was measured from April to October 2011 in both the fen and in two replicates of each bog type using absolute pressure transducers in Hobo U20 loggers (Onset Computer), installed in PVC wells that were anchored in the underlying permafrost. All continuous measurements were logged at one-hour intervals. Incident and outgoing shortwave and longwave radiation were measured near the PVC collars using a NR01 four-component net radiometer (Hukseflux Delft, The Netherlands) over eight days in September 2011.
Surveys were conducted to establish absolute elevations for water tables, well casings, and bog vegetation surfaces relative to a common benchmark near a frozen plateau site. Based on standard survey techniques and our repeated measurements, we estimate that the uncertainty of these elevations is 5–11 cm (table 1). Logged water table heights were corrected for atmospheric pressure (logged separately) and compared to manual measurements of water table height made during field campaigns. Logged water table records are incomplete after 28 July, 2011 due to bear damage of the atmospheric pressure logger.
Table 1. Site effects during the 2011 growing season at the Innoko Flats thaw chronosequence. For total C stocks uncertainties are presented as one standard deviation, while uncertainty for elevation and fluxes are one standard error of the mean (n = 3 sites except at frozen plateau where n = 6). See table S2 for age estimate details; ranges are reported here based on uncertainties shown in table S2. Fluxes of CO2 and CH4 are averages of measured values for each of three field campaigns; lower case letters indicate significant difference by Tukey's post hoc tests within each trip at p < 0.05. Mean NEE for the fen is during May and July trips only. Negative flux values represent uptake from the atmosphere to terrestrial ecosystems.
| NEE, mg CO2–C m−2 d−1d | CH4 flux, mg CH4–C m−2 d−1d | ER, mg CO2–C m−2 d−1d | ||||||||||||||||
|---|---|---|---|---|---|---|---|---|---|---|---|---|---|---|---|---|---|---|
| Site | Est time since thaw, yr | Relative elev., m | Average feature size, m2 | Total terrestrial peat C stock, kg C m−2a,b | Fraction bog peat | Sept. albedoc | May | July | Sept | May | July | Sept | May | July | Sept | Flux ratio, CH4/-NEE | Sept. CH4 ebullition at 20 cm, mg m−2 d−1e | Dominant vegetation |
| Frozen plateau | 0 | 0 | na | 61.3 ± 15.8 | 0.00 ± 0.00 | 0.14 ± < 0.01 | −1213 ± 341a | −1032 ± 870a,b | −604 ± 433a | −0.12 ± 0.09a | −0.97 ± 1.24b | 0.95 ± 11.8b | 1232 ± 255 | 1659 ± 476 | 501 ± 88 | 0.00 | — | Picea mariana, Rhododendron subarcticum, Rubus chamaemorus Cladonia arbuscula, Sphagnum fuscum |
| Young bog | 14–21 | −1.3 ± 0.3 | 2.0 ± 0.6 | 25.9 ± 16.5 | 0.09 ± 0.06 | 0.18 ± 0.01 | −1463 ± 1059a | −652 ± 421a,b | −412 ± 320a | −0.18 ± 0.27a | 1.37 ± 0.67b | 2.87 ± 2.11b | 1624 ± 17.6 | 548 ± 223 | 299 ± 82 | 0.00 –0.01 | 8.0 | Sphagnum riparium, S. lindbergii |
| Int. bog | 22–68 (<100) | −2.6 ± 0.1 | 244 ± 82 | 42.3 ± 24.2 | 0.14f ± 0.03 | 0.13 ± < 0.01 | −838 ± 577a | −1513 ± 1205a | −1038 ± 349a | 15.9 ± 11.6a | 123 ± 71a | 72.9 ± 37.8a | 640 ± 218 | 1811 ± 740 | 774 ± 164 | 0.02–0.08 | 51.9 | Eriophorum scheuchzeri, S. riparium, S. lindbergii |
| Old bog | 200–1400 | −2.1 ± 0.2 | 530 ± 182 | 64.3 ± 27.4 | 0.74 ± 0.14 | 0.15 ± 0.01 | −222 ± 514a | −206 ± 698b | −608 ± 451a | 1.16 ± 1.27a | 6.55 ± 2.23b | 6.75 ± 2.99b | 1488 ± 419 | 1553 ± 530 | 499 ± 128 | 0.01 –0.03 | 65.3 | Andromeda polifolia, Oxycoccus microcarpus, Carex rotundata, Sphagnum balticum, S. flexuosum |
| Fen | 300–1300 (<1700) | −2.8 ± 0.1 | na | 48.0 | — | 0.14 ± < 0.01 | 234 ± 337a | −874 ± 241a,b | — | 11.2 ± 4.49a | 38.3 ± 11.5b | 33.3 ± 21.0a, b | 791 ± 207 | 508 ± 310 | −0.05 −0.04 | 65.9 | Carex limosa, C. rotundata, Eriophorum scheuchzeri, Sphagnum papillosum, S. majus, S. fallax, Menyanthes trifoliata | |
aMean and one standard deviation for three frozen, forested plateau sites is 53.8 ± 9.6 kg C m−2. Value shown includes three drying margin locations at bog edges representing ice free carbon inventory of forested plateaus (total n = 6). b n = 1 for the fen site; n = 3 for the young bog, intermediate bog, and old bog; n = 6 for frozen plateau cAlbedo estimates for the frozen plateau and young bog sites refer to the forest floor and exclude any overlying trees. dMean and one standard deviation for flux measurements on each trip (May, July, September). eEbullition over a 24 h period based on accumulation of CH4 in a bubble funnel trap placed 20 cm below the bog surface. fMean C stock for intermediate bogs is a minimum value because the forest peat stock may be underestimated in replicate 1. Fraction bog C is calculated using replicates 2 and 3. See table S1 for individual replicate values.
2.4. Age of collapse features
Peat coring revealed transitions between forested plateau peat and bog peat based on macrofossil indicators, generally Chamaedaphne or Sphagnum riparium for bog peat. Forested peat was recognized by char, needles, and bark; bog peat was recognized by brown mosses and sedge peat. Permafrost thaw was inferred from proximity to surface collapse boundaries and the presence of this forest-bog peat transition in peat cores. Two radiogenic isotopes, 210Pb and 14C, were used to estimate age of transitions. 210Pb was measured on bulk peat of shallow strata where unsupported 210Pb was detectable (∼60 cm); we used the constant rate of supply (CRS) method to calculate ages of basal horizon depths (Appleby and Oldfield 1978). We report 210Pb ages only on profiles in which inventories of 210Pb were confirmed by the absence of unsupported 210Pb at the base of the profile; uncertainties in210Pb ages from the CRS method are based on error analysis described in VanMetre and Fuller (2009). 14C was measured in macrofossils where identified or on bulk peat picked free of roots. We compared 210Pb and 14C age results from a pair of sites at Koyukuk Flats, Alaska and found close agreement of age methods (see tables S2, S3); we therefore used CRS ages in younger materials (young and intermediate features) and 14C ages in older materials (old bogs and fen) at Innoko depending on available datable materials.
2.5. Gas fluxes
Net ecosystem exchange (NEE), ecosystem respiration (ER), and CH4 exchange were measured during three ten-day field campaigns during the early (end of May to early June), middle (end of July to early August) and late (end of September) periods of the 2011 growing season using static chambers (Carroll and Crill 1997; see supplemental text). During flux measurements air temperatures inside and outside the chamber were manually measured using thermocouples (Fluke Corporation, Everett, WA). Clear chambers were used for NEE measurements and opaque chambers were used for ER and CH4 measurements, with gas concentrations measured in-situ using an infrared gas analyzer (LI-COR or PP Systems; NEE and ER) or by manual collection for analysis of CH4 by gas chromatography (GC). Photosynthetically active photon flux density (PPFD) was measured manually using a quantum meter (Apogee Instruments) within the clear chambers during NEE measurements.
Our gas flux sampling strategy sought to capture a range of light and temperature conditions over the course of each field campaign. Fluxes were measured in diurnal rounds for each replicate set of sites, with four to six measurements of both CO2 and CH4 flux during a 24 h period. The exception was at the fen locations, where CH4 was consistently evaluated throughout the season, but CO2 measurements were curtailed in September due to difficulty with access and site disturbance. NEE is defined as the sum of ER and gross primary production (GPP):

where negative values of GPP and NEE (μmol CO2 m−2 s−1) indicate CO2 uptake. During the September trip, CH4 ebullition fluxes were quantified based on the concentration of accumulated CH4 in funnel traps (7.6 cm diameter) placed below the water table surface. Traps were backfilled with water then allowed to accumulate gases released by ebullition over a 24 h period, then sampled for assessment of volume and GC analysis.
Three separate trips were made and are distinguished by their month of campaign (May, July, September). Within each of these trips, which represent different seasonality, we evaluated the statistical effect of site type on the measured gas fluxes. To make this assessment, we used R (R Development Core Team 2011) and the lme function (nlme package) to fit a mixed effects model accounting for the repeated measures on three different locations for each site type and also fixed effects accounting for air temperature in the flux chamber and an interaction between site type and month of campaign. We performed three collections of family-wise controlled Tukey HSD tests to compare each site type to each other site type in order to ascertain which types are associated with a significantly different flux, on average, after accounting for temperature, within a given trip, at a significance level of p < 0.05.
3. Results
3.1. Site characterization and C stocks
This sequence of forested plateaus and collapse scar bogs captures dramatic changes in vegetation, feature size, and feature elevation with thaw progression (table 1, figure 2, table S1) (see also Camill et al 2001). The forested plateaus are characterized by an apparent shallow permafrost table (based on four years of observation) and a black spruce (Picea mariana) canopy with an understory of Rhododendron subarcticum, Rubus chamaemorus Sphagnum fuscum, and Cladonia spp. The three bog types differ in size of feature, relative elevation, thickness of bog peat, vegetation type, and forest/bog transition age. The young bogs are small collapse scars (2.0 ± 0.6 m2 in area) within the permafrost plateaus that lack woody vegetation, exhibit thaw-induced lowering of the ground surface by 1.20 ± 0.11 m relative to plateaus, host shallow water tables with acidic pH (4.1–4.6), and are dominated by S. riparium, and S. lindbergii. Intermediate bogs form large scars (243.7 ± 82.1 m2) at elevations 2.6 ± 0.1 m below plateaus; contain shallow, acidic water tables (pH 3.9–4.3); and host vegetation dominated by Eriophorum scheuchzeri, S. riparium, and S. lindbergii. Old bogs are also acidic (pH 3.9–4.2), and larger (530.4 ± 182.4 m2), with 2.1 ± 0.6 m collapse, hummocky microtopography and vegetation dominated by Andromeda polifolia, Oxycoccus microcarpus, Carex rotundata, S. balticum, and S. flexuosum. The fens are slightly less acidic (pH 4.4–4.8), and are lower in elevation than plateaus by 2.84 ± 0.05 m; they form pronounced linear features with slow surface water movement, and support vegetation dominated by Carex limosa, C. rotundata, E. scheuchzeri, S. papillosum, and S. majus.
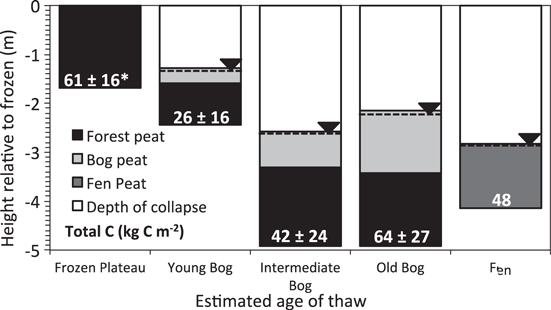
Figure 2. Depth of collapse for frozen (0 yr), young (14 to <21 yr), intermediate (22 to >68 yr), old (∼200 to >1400 yr) thermokarst bogs resulting from permafrost thaw at the Innoko study site (n = 3 replicates per landscape unit). Total depth is measured to the forest peat-silt layer at frozen and bog sites and to the limnic silt layer at the fen. Numbers inside bars indicate total carbon stocks (kg C m−2, ±1 standard deviation; n = 1 fen site; n = 2 for the young bog, intermediate bog, and old bog; n = 6 for frozen plateau including three sites along plateau/bog margin). Total C stocks include all peat types; due to variability of replicates, bog peat did not increase significantly with mean age of site type (n = 2 ages per site type in bogs; table 1), and total C stock was significantly reduced only in young compared to forest and old sites. Each elevation is averaged across three field replicates with uncertainties ≦̸0.11 m (table 1). The relative elevation of the average water table position to vegetated surface is denoted with dashed line and inverted triangles (n = 9, 3 sites × 3 dates). Water tables rose and fell by several cm over the course of growing season, but remained within 2–5 cm of the floating mat surface in the young and intermediate bogs, and 10–15 cm from the surface in the old bogs.
Download figure:
Standard image High-resolution imageShallow water tables were maintained in all bog features during the 2011 growing season, as rainfall (20.5 cm) was balanced by water level decreases in bogs. In bogs, both surveys and logged water levels indicated decreases of ∼10 cm in water levels during 1 June–25 July. Comparable net gain was observed in survey results for 25 July–25 September, such that water levels in a given bog type on 25 September did not differ from those on 1 June, though the absolute elevation of water levels differed among bog types (figure 2).
Average total C stocks in terrestrial peats (bog plus forest peat) at Innoko Flats ranged from 28 ± 11 to 69 ± 12 kg C m−2 along the chronosequence and were significantly reduced in young compared to forest and old site types (p = 0.05; figure 2; table 1). In addition, the mass fraction of bog peat increased with time since thaw (table 1).
3.2. Thaw chronosequence
Peat cores of young bogs revealed bog peat to within 20 cm of the surface underlain by forest peat. The CRS approach using basal depths in cores from two young bog sites indicates that bog peat close to the forest-bog transition in these features was about 15 and 18 yr old (range of 14–21 yr with uncertainties), with underlying forest peats indicating ages of 34 and 46 yr (table 1; table S2). Repeated collapse was indicated in cores of all three intermediate bogs, with bog peat above the most recent collapse transitions showed CRS ages of 45 and 37 yr (range of 22 to 68 yr with uncertainties; table 1; table S2), and an age in underlying forest peat of ∼100 yr (table S2). Bog peat in old cores ranged from ∼200 to 1400 yr in uppermost collapses based on 14C ages, and with maximum age constrained by macrofossils within underlying forest peat material dating to 1600 yr (table 1; table S2). Our age estimates for young, intermediate, and old bogs reflect most recent collapse timing, with ranges of 14–21 yr, 22–68 yr, and 200–1400 yr, respectively, prior to AD 2009, the time of sampling. Fen locations with active flow (IFIF in table S2) were comparable in age to old bogs (table 1, table S2).
3.3. Trace gas exchange
CH4 emissions at intermediate age sites were significantly higher than those of all other sites in July and were significantly higher than frozen plateau, young bog, and old bog sites in September (table 1; figure 3). The most pronounced seasonal peak in CH4 emissions occurred at the intermediate age sites (figure 3). Mean CH4 efflux rates from the intermediate age features were 123.3 ± 70.6 mg CH4–C m−2 d−1 in July and 72.9 ± 37.8 mg CH4–C m−2 d−1 in September (table 1, figure 3). In the permafrost plateau and young sites, CH4 emissions were small, with low or negligible rates of uptake generally observed on the plateaus (−0.97 ± 1.24 mg CH4–C m−2 d−1 in July), and low or negligible emissions observed at the young and old sites (1.37 ± 0.67 mg CH4–C m−2 d−1 and 6.55 ± 2.23 mg CH4–C m−2 d−1, respectively, in July). Fluxes of CH4 at the fens in July were moderate and did not differ significantly from any other site type, producing 38 ± 11 mg CH4–C m−2 d−1 (table 1, figure 3).
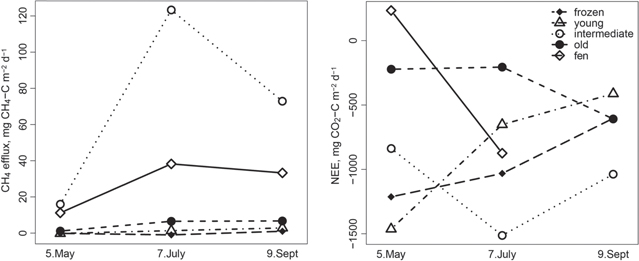
Figure 3. Site-by-trip interaction plots for CH4 flux (left) and NEE (right) at the five site types on three trips during the 2011 growing season (n = 3 locations for each site type). CH4 flux data and NEE data were both modeled using a linear mixed effects model accounting for the repeated measures on three different locations for each site type with fixed effects for air temperature and an interaction between site type and trip. Both analyses resulted in a significant interaction between site type and trip (p < 0.0001 for CH4, p < 0.005 for NEE). Post-hoc Tukey HSD tests were performed to distinguish differences between site types within each trip, with a significance level of p < 0.05 (see table 1). For the CH4 data, the intermediate bog site was significantly different from the frozen plateau, young bog, old bog, and fen sites in July. In September, the intermediate bog site was significantly different from the frozen plateau, young bog, and old bog sites. No sites were significantly different in May. For the NEE data, the only significant difference among sites within a trip was between the intermediate and old bog sites in July.
Download figure:
Standard image High-resolution imageIn the NEE and CH4 efflux data, we observed an interaction between site and date (trip) (figure 3), with a significant effect of air temperature on NEE and ER but not CH4. In contrast with air temperature, logged 25 cm soil temperatures were warmer at the intermediate and old bogs compared to the young bogs and frozen plateaus (figure 4). At both intermediate and old bogs, temperatures remained above 0 °C at 25 cm depth for about two weeks longer at the end of the season, and soils at 25 cm depth were 2.5 °C warmer on average than frozen plateaus and young bogs (figure 4). In young bogs and frozen plateaus, cooler soil temperatures were associated with lower mean CH4 emissions (table 1, figures 3 and 4). In intermediate bogs and fens, warmer 25 cm soil temperatures and shallow water tables were associated with enhanced CH4 emissions. Frozen plateaus and old bogs were dryer at the surface, and had lower CH4 emissions or uptake.
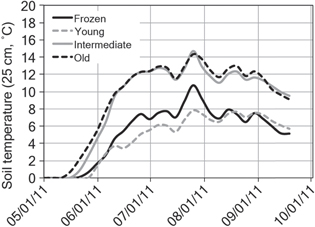
Figure 4. Soil temperature. Continuous soil temperature at 25 cm depth during 2011; the intermediate and old sites were significantly warmer than the frozen and young sites (p < 0.05). In young bogs (IFYB), cooler soil temperatures are associated with reduced mean ER and CH4 emission (table 1, figure 1). Warmer 25 cm soil temperatures are associated with enhanced CH4 emissions in intermediate bogs (IFIB), which also have shallow water tables. Frozen plateaus (IFUW) are both colder and dryer with negiligible CH4 emissions or uptake, while old bogs (IFOB) are warmer but dryer, with reduced CH4 emissions and more limited NEE (figure 3).
Download figure:
Standard image High-resolution imageEbullition fluxes provide additional evidence of drivers. During September, one-time measures of shallow subsurface (20 cm depth) CH4 ebullition fluxes were comparable to average surface diffusive fluxes at the intermediate bog and fen sites, but greater than surface diffusive fluxes at the old bogs (table 1). In addition, ebullition fluxes increased with depth in September 2011, particularly in intermediate and old sites, consistent with observations of dissolved CH4 concentrations in porewaters that increased with depth in September 2009 (figure 5).

Figure 5. Methane profiles with depth at Innoko Flats. (left) Dissolved CH4 (ppm) with depth for each site type, collected during the 2009 growing season. For dissolved CH4 methodologies, see Wickland et al (2006). (right) Flux of CH4 with depth from bubble traps, during a 24 h period in September 2011. Site types are abbreviated as: young bogs (YB), intermediate bogs (IB), and old bogs (OB).
Download figure:
Standard image High-resolution image
Seasonal and chronosequence patterns were less evident in NEE, with little difference among site types (table 1, figure 3). NEE did not differ among site types except in July, when old bogs had reduced rates compared to intermediate bogs (table 1, figure 3). While variable, the NEE data follow the predicted response to light with scatter that may reflect variation in temperature (figure S1). The ER-temperature response and NEE-light and temperature response (equations (S3), (S4)) did not differ dramatically among landscape units (figure S1). Thus we observed an increase in the ratio of CH4 efflux to NEE uptake—a metric for assessing net radiative forcing effects (Frolking et al 2006)—at the intermediate sites as a result of increased CH4 efflux (table 1).
4. Discussion
4.1. Enhanced CH4 efflux at intermediate bogs
With increasing time since thaw, our surveyed elevations illustrate the progression of physical collapse and inundation, with a maximum collapse of over two meters in the intermediate bogs (figure 2, table S1). The depth of physical collapse seen in the intermediate bogs is consistent with the ice content in the upper 3–4 m of the frozen plateau sites (>2 m) (Kanevskiy et al 2014) suggesting that thaw drove all or most of the lowering (with limited influence from peat decomposition). Old bogs exhibit about 20 cm higher elevation relative to the intermediate bogs, apparently due to new bog peat accumulation (figure 2).
During the growing season, young and intermediate bogs maintained the shallowest water tables and supported a plant community dominated by S. riparium, and S. lindbergii, with a less consolidated surface peat mat compared to that of the old bogs, which were dominated by S. fuscum. These conditions at young and intermediate bogs suggest enhanced anoxia and atmospheric exchange that promotes CH4 efflux and/or reduced opportunity for CH4 consumption. Combined with the temperature data, this suggests that intermediate bogs support the most optimal conditions for CH4 efflux—warmer subsurface temperatures and shallow, fluctuating water tables, with a floating mat that lacks the physical integrity of the older bog sites and thus is less likely to restrict CH4 efflux (Kane et al 2013, Dise et al 1993, Heikkinen et al 2002, Coulthard et al 2009).
Comparing landscape units, CH4 emissions were highest at intermediate bogs (figure 3) and were comparable to or exceeded previous observations in other thermokarst wetlands (Wickland et al 2006, Olefeldt et al 2012), consistent with the combination of both warmer and wetter conditions characteristic of those sites. Depth profiles of dissolved CH4 (in September 2009) and CH4 ebullition (in September 2011) support an interpretation of enhanced subsurface production at intermediate and old sites (figure 5). At intermediate sites, both dissolved CH4 concentrations and CH4 ebullition fluxes increased with depth, suggesting enhanced production relative to younger sites and enhanced surface emission relative to old bog sites, where subsurface fluxes and dissolved concentrations were also elevated in some cases (figure 5). Enhanced CH4 efflux at intermediate sites could reflect the less indurated peat mat compared to old bogs, as well as plant transport due to the presence of e.g., E. scheuchzeri (Ström et al 2012, Joabsson 1999, Noyce et al 2014). At old bogs, methanotrophy and physical limitation by the solidified peat mat may limit CH4 efflux at the surface (Zhuang et al 2007, Turetsky et al 2008, Parmentier et al 2011, Coulthard et al 2009), compared to ebullition flux at greater depth (figure 5).
Moderate CH4 production was also observed at the fen locations (table 1, figure 2), consistent with previous work on fen systems (Olefeldt et al 2012). The fen system is distinct from the bogs due to groundwater flow and hence potential nutrient supply (e.g., Kokfelt et al 2010). Combining areas of active flow where most observations were made (IFIF sites) with relict fen areas now appearing to function more like bogs (including an older or relict fen area (IFOF) with a 14C date of ∼1650 yr; table S2), the fen system comprises a substantial proportion of the landscape (e.g., 26% of the area in figure 1). The contribution of the fen system to CH4 fluxes may reflect the interaction of the regional flow system with peatland development following widespread thermokarst lake development 8–10 ka BP (Kanevskiy et al 2014). Our observations indicate that CH4 emissions from the fen system merit further investigation (table 1) (Crawford et al 2013).
4.2. Century and millennial scale ecosystem response to permafrost thaw
Peatlands in the boreal region typically store large amounts of C and therefore have acted as a long-term net sink for CO2 (Smith et al 2005, Heyer et al 2002, Roulet et al 2007, Malmer et al 2005, Dunn et al 2007). At Innoko, we observed decreased total C stocks in young compared to frozen forested plateau and old bog sites, and the proportion of bog peat increased from 9% to 74% with time since thaw in young to old sites (table 1, table S1). Therefore, forest peat likely decomposed during bog peat accumulation, as seem in a similar thaw chronosequence at Koyukuk Flats (O'Donnell et al 2011a). At Koyukuk, O'Donnell et al observed a 57% reduction of forest peat after 300 yr of thaw, in an older deposit with larger initial C stocks (137 ± 37 kg C m−2). At Innoko, we observed a comparable decrease (55 ± 24%) between frozen plateau and intermediate+old sites over a time period of decades to centuries. Future analyses of peat in these permafrost lowland settings should investigate the tradeoff of forest peat decomposition for bog peat accumulation.
At Innoko, ratios of CH4 emission to NEE (uptake) across the growing season ranged from negligible in the frozen plateau to 0.08 at intermediate bogs (table 1), indicating positive radiative forcing potential within a few decades of thaw as a function of enhanced methanogenesis at these warmest, wettest sites. In addition, enhanced CH4 efflux during shoulder seasons might add to CH4 flux (with minimal NEE) beyond what we observed during the growing season, enhancing net positive radiative forcing over the year (Mastepanov et al 2008, Jackowicz-Korczyński et al 2010). Although growing-season NEE rates remained similar to those observed elsewhere (Wickland et al 2006, Frolking et al 2011, Street et al 2012), enhanced CH4 emissions during the growing season with intermediate stage thaw could yield a net positive radiative forcing from these sites for up to half a century or so using the approach of Frolking et al (2006) (figure S3), regionally at a level dependent on thaw area and duration of intermediate stage thaw.
The period of elevated CH4 emission in intermediate stages of thaw at Innoko begins with a threshold transition from net negative to net positive radiative forcing and continues over timescales of decades to centuries. This threshold occurs at a landscape stage that is typified by reduced albedo, warmer temperatures, and shallower water tables. The timescales observed for this threshold at Innoko are generally consistent with previous experimental work on CH4 production with peatland thaw in northern Canada (Turetsky et al 2007) and in Alaska (Klapstein et al in press); the work presented here suggests this threshold can occur after ∼32 to 68 yr of thaw but is not sustained for much more than ∼100 to 200 yr. Thus this thaw chronosequence approach implies a period of enhanced CH4 emissions and subsequent reduced emissions with thaw progression over decades to centuries at Innoko Flats.
4.3. A general conceptual model for gas flux response to thaw
A conceptual model for thaw-gas flux response is suggested by our chronosequence approach at Innoko Flats, consistent with previous studies. Permafrost thaw and shifts in vegetation contribute to the altered hydrological and thermal conditions that predispose intermediate thaw features to enhanced CH4 emissions. In black spruce forest, permafrost may be sustained by shading from the forest canopy and thick organic soils (Shur and Jorgenson 2007), as well as the presence of light colored Cladonia lichens that reflect radiation and limit ground heat flux from the forest floor (Stoy et al 2012). Once young bogs are initiated, inundation supports S. riparium communities at the expense of Cladonia spp., while continued shading by trees in the wet young bogs reduces incident radiation (table 1, S1). Young bogs remain cold as they create small depressions within the surrounding permafrost, but even their limited physical collapse promotes absorption of additional radiation and accumulation of runoff that further promotes thaw and maintains a shallow water table. Expanded collapse to form intermediate bogs eliminates shading through tree-kill (figure S2), decreases albedo (table 1) and continues to promote shallow water tables both from thawing ice rich permafrost and from rainfall accumulation.
The combination of warmer soil temperatures and shallower water tables leads to dramatically enhanced CH4 production mid-summer and over the course of the growing season in the intermediate age bogs (figure 3). A positive C balance may persist, as indicated by bog peat accumulation over decades to millennia (table 1, figure 2) (O'Donnell et al 2011b) and CO2 uptake outweighing CH4 release during the growing season (and arguably over the annual cycle) in sites along this thaw gradient (table 1). Nevertheless, net positive radiative forcing effects may also occur for several decades (figure S3) (Frolking et al 2006). Eventually, the succession of vegetation and accumulation of peat over hundreds of years in old bogs physically elevates the land surface (figure 2). Along with the transformation to dwarf evergreen shrub and S. fuscum, soil and vegetation physically insulate the subsurface, which may in turn limit lateral thaw propagation, increase CH4 consumption, and enhance absorption of solar radiation as indicated by reduced albedo (table 1) (Bonan et al 1992). Under more constant climate conditions, this vegetation succession could lead to re-aggradation of permafrost (Briggs et al 2014) and re-establishment of black spruce communities, but this outcome may be increasingly unlikely with a warming climate (Johnson et al 2013).
The role of fens in connection with subsurface waters is of key importance to the trajectory of permafrost thaw. Fens exhibit high water tables, reduced albedo, and tend toward higher CH4 fluxes when compared to frozen plateaus (table 1). In some situations, fen locations can facilitate more rapid permafrost loss through thermal effects of flowing water (Jorgenson et al 2001). However, the spatial distribution of fens in permafrost landscapes is particularly variable and may not be easily generalized.
5. Conclusions
Thawing of ice-rich peat results in water impoundment, soil saturation, and both vertical and lateral thaw propagation. This progression in turn leads to soil warming and increasing CH4 emissions where fine textured mineral substrate limits drainage, over timescales of decades to a few centuries. In peat deposits on poorly drained silts in western Alaska, these CH4 emissions may reflect a loss of older forest peat that has accumulated during the mid- to late Holocene, even as CO2 uptake is now resulting in accumulation of new bog peat. After ∼200 yr post-thaw, peat accumulation, water table lowering, and subsurface cooling—which have likely occurred cyclically over the lifetime of the feature—cross a threshold to enhanced surface drying and physical limitation of gas fluxes, reducing CH4 emissions and NEE. At Innoko Flats, as is common in other boreal permafrost lowlands, permafrost collapse has created a complex mosaic of small thermokarst bogs of varying ages and states of thermal succession, each with differing rates of trace gas emissions. While further warming is likely to increase the frequency of thawing of permafrost plateaus, the areal extent of bogs relative to forest plateaus at this site (figure 1) suggest that >60% of the permafrost is in a thawed state, and hence that elevated CH4 production from this area relative to other regions is occurring now. The limited thickness of the Innoko peat deposit is likely related to its relatively young age (Kanevskiy et al 2014), and may have facilitated spatially extensive thaw over the past few decades, such that enhanced CH4 production is currently occurring in this region of extensive poorly drained mineral substrate. If permafrost peatland thaw progression increases hydrologic connection with flow systems through extensive landscape lowering (bog transformation to fen) sustained CH4 production may result, particularly in areas of poorly drained substrate such as lacustrine silts.
Acknowledgements
This research was made possible by funding from the National Science Foundation (EAR #0630319 and DBI #1021095), the United States Geological Survey, the Montana State University College of Agriculture, and the MSU VP of Research, with assistance from the North and West Alaska Cooperative Ecosystems Studies Unit, and crucial logistical support by the US Fish and Wildlife Service. Thank you to Jon O'Donnell and Mikhail Kanevskiy for soil sampling and initial instrumentation, as well as ongoing discussion of permafrost landscape evolution, to Jennifer Weeding and Michael Lerch for assistance with statistical analysis, and to Miriam Jones for soil analyses and insight. Thanks also to Rob Striegl for discussion of field strategy, Paul Stoy for assistance with flux measurements and for undertaking radiation measurements, Miriam Jones for assistance with age estimates, Aiden Johnson for assistance with albedo analysis, and to Christine Miller, Chris Dorich, Claire Treat, and Chris Welch for lively participation in fieldwork. Additional thanks to Karin Bodony of USFWS and Jim Webster of Webster Flying Service for superb logistical support, and to Paul Stoy, John Crawford and three anonymous reviewers for their comments on previous versions of the manuscript, which substantially improved this paper.