The Forgotten History of Female Mapmakers
Looking back at a few of the women who quietly made their mark on cartography
In the 1970s, early in her career as map librarian at the New York Public Library, Alice Hudson started researching women mapmakers throughout history. With few other women in her chosen field, she wondered how many had come before her. “I thought I might find 10,” she tells CityLab.
But over the years, as she combed through maps, censuses, newspapers, and tips from colleagues, she was amazed by how many women there were in the early days of mapmaking. By the late ‘90s, she’d found over a thousand names of women who had drawn, published, printed, engraved, sold, or traded maps prior to 1900 alone.
Reading mainstream history books, or coverage of old maps, you might never know that women historically had much of a role at all in cartography. But really, they’ve been involved in mapmaking about as long as any man has. Women have made maps to chart territories, educate students, sell propaganda, convey data, argue policy, and make art. In other words, women have made maps, period. And they continue to, as this century’s geospatial revolution turns.
Which women, and when? Mapmaking spans genders, centuries, cultures, and technologies. A complete history of women in cartography would require many volumes of pages, and possibly a graduate degree. I’ve narrowed my selection to works by women mapping North America over the past 300 years. Within this “small” range is a diversity of stories, styles, and approaches that, collected together, should provoke curiosity about the many more ways women have mapped the world.
Cartography exploded in 17th- and 18th-century Europe, a period sometimes called the Age of Discovery. European explorers and settlers were competing for conquests and territory in the Americas, and navigational tools of all kinds proliferated and evolved in support of them. Women were involved in mapmaking during this time, though they almost invariably learned the trade through the men in their lives.
Mary Ann Roque—who was among the first women Hudson discovered in her research—was one of these mapmakers. Long after her husband, John Roque, died in 1762, she carried on his prominent London map business, printing and selling maps of the world that he had drawn. One such map of North America is on display now at the Boston Public Library, in an exhibit curated by Hudson called “Women in Cartography.”
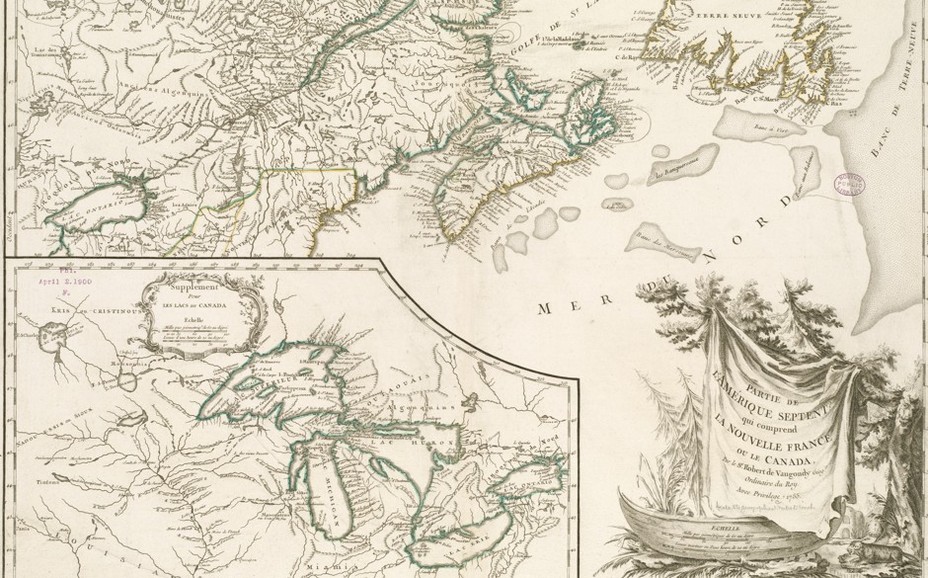
Around the same time, in Paris, sisters Marie Catherine Haussard and Elizabeth Haussard were well-known for their engravings of “cartouches”—the label that identifies the subject of a map and its author, often with a decorative touch.They’d learned how to engrave from their father, but it was their own talents that brought them success. In the detail of the map of Eastern Canada shown above (also included in the BPL exhibit), signed by “C. Haussard,” the cartouche includes a few of the era’s popular symbols of the North American wilderness: pine trees, a beaver, and a canoe.
Both Mary Ann Roque and the Haussards used their initials instead of names to attribute their works; this was a kind of marketing technique for women mapmakers, as it hid their gender from the buying public. But it also hid many of them from history.
“Their names never appear in books about mapmaking,” Hudson says. “They’re never named in the indexes, either because it was guys who were writing the books, or because the primary item was about the man who owned the business. Even when it was the wife”—or indeed, the daughters—“who had carried it on after he’d died.”
If European women mapmakers were overshadowed by their male counterparts during this era, think of how little we know about maps made by native North American women. Mapmaking was also an important, if under-recognized, accounting of the often bloody encounters between native North Americans and white settlers.
As a child of Newfoundland’s Beothuk tribe in the early 1800s, Shanawdithit witnessed her people driven to virtual extinction by violent contact with British Marines. Against all odds, she managed to survive, and eventually became known as the last “full-blooded” member of the tribe.
In her 20s, hungry and alone, Shanawdithit found work as a servant in a white settlement on the island, where she learned to read and write in English. She became the subject of anthropological interest for the explorer William Cormack, who was working to found a center devoted to Beothuk history. Under his watch, in 1829 Shanawdithit created five extraordinary narrative maps in which she compressed and plotted her memories of her tribe’s movements and collisions with the settlers some 18 years earlier. The rivers and lakes that appear in her maps are drawn with incredible geographical accuracy, according to the explorer James P. Howley, who wrote a 1915 history of her tribe, The Beothucks or Red Indians. The Beothuk people and all that pertained to them are marked in red, and the British in black.
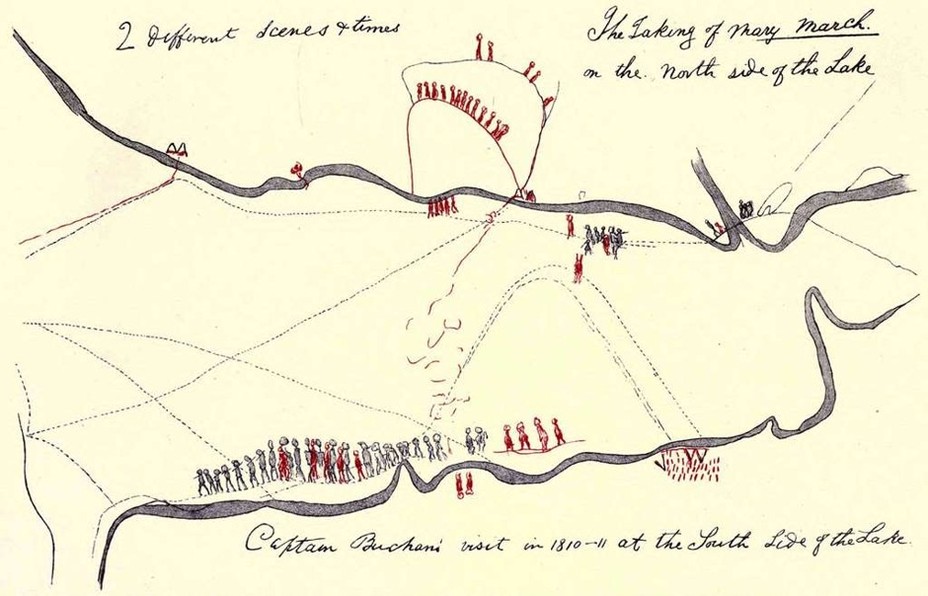
In the map pictured above, Shanawdithit depicted the capture of her aunt, Demasduit, whose English name was “Mary March.” Howley describes this map:
This sketch is labelled “The taking of Mary March on the North side of the lake.” And in another place “Two different scenes and times.” It depicts, on a large scale, the North East Arm of Red Indian Lake. On the south side is again seen [Captain David] Buchan’s party, marching in single file towards the outflowing river, with the accompanying Indians in red. Also the four Indians approaching to kill the two marines.
… A third red line extends out on the lake upon which four figures are shown. In front of the wigwams on the ice are grouped half a dozen black, with one red figure in their midst. Standing near this group is a single red figure apparently of a large man, as if in the act of haranguing the group, while a little to one side is another red figure lying prone on the ice. It is almost needless to say this represents the furriers taking Mary March, her husband coming back to the rescue, and his dead body, after being shot, lying on the ice.
Other native North Americans drew maps that depicted their encounters with European settlers, though very few have survived the centuries. Shanawdithit’s maps, and the stories she told Cormack, are among the last accounts of her people’s language, customs, and beliefs—and have become symbolic of a tragic chapter in Canadian history.
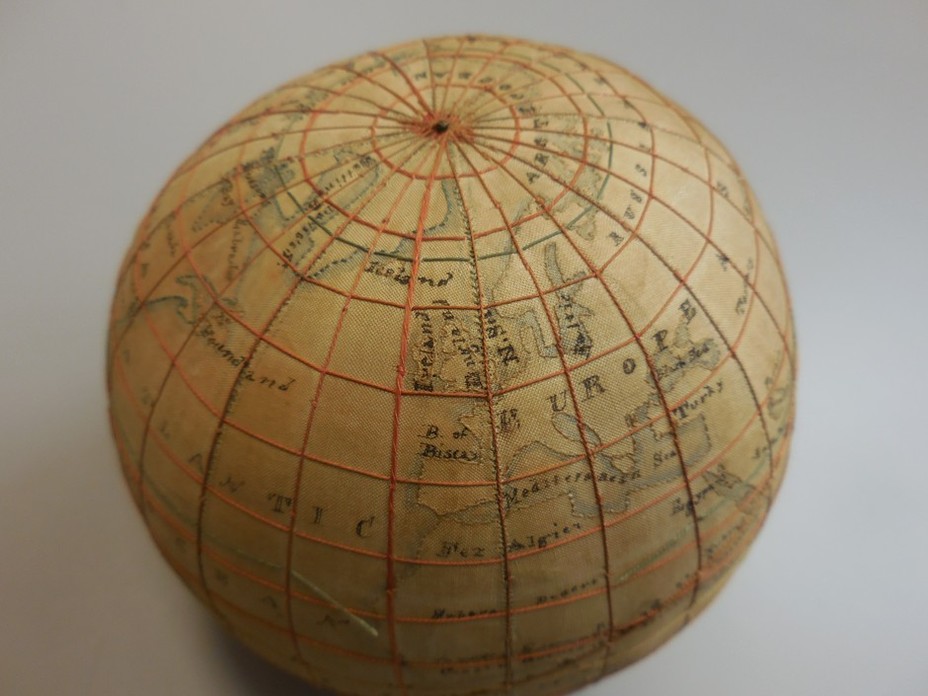
The turn of the 19th century was a time of tremendous change on the North American continent, as new nations established their laws and societies. Among many other transitions, education was changing for young women. In the nascent United States, secondary schooling for girls proliferated for the first time. Academies taught the old domestic skills, such as sewing, music, and fine etiquette, but they also taught “solid subjects,” such as mathematics, history, and geography. In this moment came an object that blended these shifting educational domains: the embroidered silk globe.
Produced by older female students at the Westtown School in Pennsylvania during the first half of the 19th century, these exquisite works were designed to teach geography, astronomy, the use of globes, and needlework all at once. Only a few inches in diameter, the globes were made of silk stretched over a wool-stuffed canvas form. The students would map longitude, latitude, and the tiny outlines of continents in simple stitches, and use ink to write the labels. And yes, they were actually designed to be used.
Other schools for girls (in both the U.S. and the British Isles) had students create embroidered maps on flat pieces of linen, rather than spherical globes. But the practice of combining stitchery with geography in any shape died out around the 1840s. Judith Tyner, a professor of cartography at California State University, Long Beach, who has written on this practice, suspects that this was because paper and pencils became cheaper, so girls started drawing maps instead. An example of this can be found in this map of the U.S. by the student Mary E. Johonott, dated 1822.
As the 19th century rolled on and into the 20th, women continued producing maps that conveyed all kinds of messages, from Civil War-era propaganda to urban statistical data. I’ll explore some of them at CityLab on Wednesday.
This article appears courtesy of CityLab.