How Twitter Has Changed Over the Years in 12 Charts
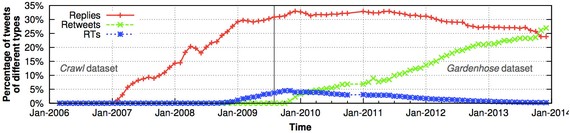
Replying is dying, retweeting is up, North America isn't dominant anymore, but English is, and more lessons from 37 billion tweets.
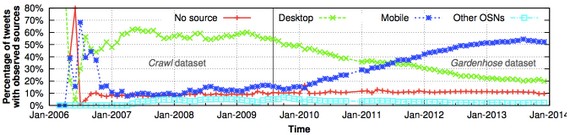
It's been eight years since Twitter debuted. Like the rest of the social networks that have survived, it has changed, both in response to user and commercial demands. The user interface, application ecosystem, geographical distribution, and culture not what they were in 2010, let alone 2006.
But each Twitter user sees the service through his or her own tiny window of followers and followed. It's hard to tell if everyone's behavior is changing, or just that of one's subset of the social network. Now, new research from Yabing Liu and Alan Mislove of Northeastern with Brown's Chloe Kliman-Silver attempts to quantify the way tweeting has changed through the years.
"Twitter is known to have evolved significantly since its founding," they write, "And it remains unclear how much the user base and behavior has evolved, whether prior results still hold, and whether the (often implicit) assumptions of proposed systems are still valid."
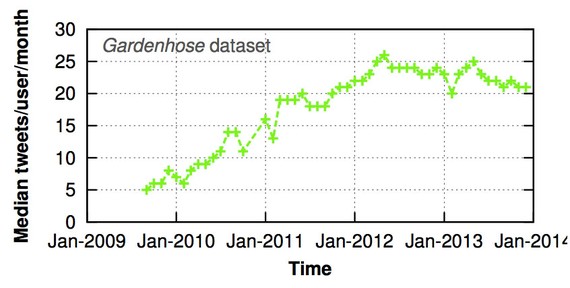
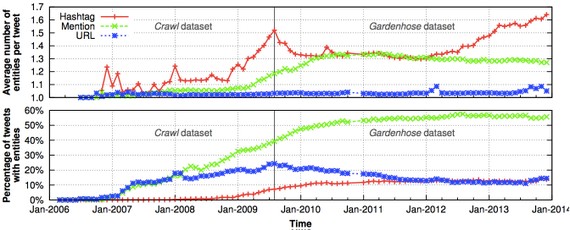
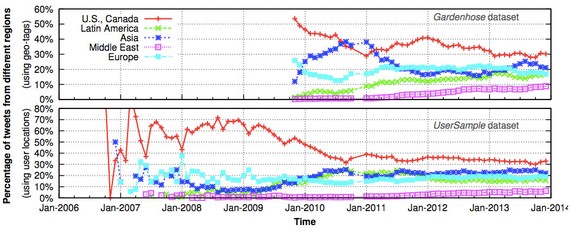
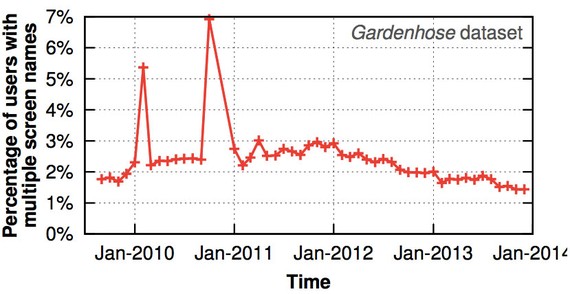
While their paper is directed at fellow researchers, their results might be of interest to anyone whose ever used Twitter. They combined three datasets to come up with 37 billion tweets from March of 2006 until the end of 2013. The key thing to know is that they talk about two different datasets: What they call the "crawl" dataset constitutes all the tweets, and what they call the "gardenhose" dataset constitutes only a sample of either 15 percent of all tweets (until July 2010) or 10 percent of all tweets (after July 2010).
OK, with that caveat, here are some of their most interesting findings.