December 2, 2013 — When tropical ecologist Greg Asner glances down at the Amazon tree canopy from the window of his twin-engine plane, he sees more than indeterminate treetops punctuated by looping rivers and bright bursts of flowers.
With a spectrometer mounted in a shiny gold canister behind him, he is “fingerprinting” individual tree species in an effort to draw the first large-scale biodiversity map of the world’s biggest expanse of tropical forest.
Scientists know the Amazon is astoundingly diverse, but they don’t know how many tree species grow there, or exactly how they are distributed. Asner’s goal is to fill that gap by taking a large-scale snapshot of Amazonian biodiversity against which scientists can track changes over time.
It’s a race against time. Recent studies show that some tree species are already shifting their ranges upslope in search of cooler conditions.
“Our driving question is whether protected areas are in the wrong place for future climate,” says Asner, a staff scientist at the Carnegie Institution for Science at Stanford University, who has spent more than a decade refining his airborne spectrometry system.
It’s a race against time. Recent studies show that some tree species are already shifting their ranges upslope in search of cooler conditions. Asner maintains that mapping biodiversity from the air — rather than depending solely on field plots on the ground — is the only way to gather information fast enough from a large enough area to answer that question before it’s too late.
Most satellite data show whether an area has tree cover, which allows researchers to track deforestation. By picking out individual species, however, Asner’s system takes a leap forward to identifying specifically what grows where. “The idea is to dissect the Amazon into something more than green and not green,” he says.
Unique Signature
Climbing out of the Peruvian jungle town of Tarapoto, the Dornier 228 Asner uses to make his observations crosses the Cordillera Azul and cruises over the lowlands at a speed of about 150 knots.
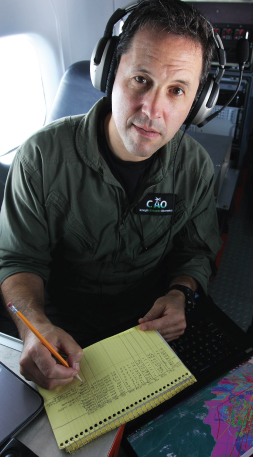
Tropical ecologist Greg Asner makes notes about his spectrometer-equipped aircraft’s course using a multicolored map depicting geology, climate and topography. Photo by Barbara Fraser.
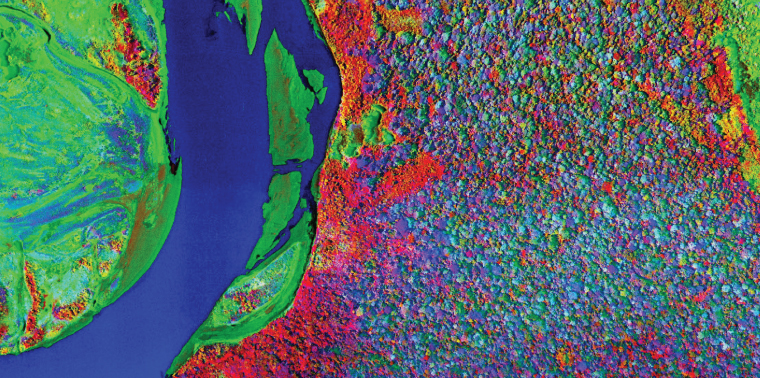
To set the course, Asner uses a color-coded map that’s a mash-up of topography, geology, precipitation and temperature. The lowlands show up as a large monochromatic block, but the eastern slope of the Andes Mountains is a kaleidoscope of tiny colored patches, reflecting the extremely varied conditions there.
Asner traces rectangles over the areas that appear most diverse, and the pilot flies back and forth as the instruments scoop up data at the rate of 14 hectares per second. Analyzing the light reflected from leaves in the tree canopy, the spectrometer detects 21 chemicals. For each species, those chemicals combine into a unique signature shaped by the geological and ecological conditions in which it evolved and the pests and pathogens to which it has developed resistance. By the end of the day, the computers will have stored 2 terabytes or more of data.
The mapping is so precise that a field team on the ground can pinpoint a tree, climb it, lop off a canopy branch, crush the leaves, analyze their chemical composition and compare it to the spectrometer’s data to be sure the instrument is calibrated correctly. Asner calculates his system’s accuracy at about 80 percent, and he continues to refine it, working with NASA’s Jet Propulsion Laboratory. His team also gathers data on the ground from a network of more than 400 field plots staked out in the Peruvian Amazon. He expects to more than double that number soon.
Still Early
While remote sensing is unlikely to eliminate the need for Earth-bound studies, large-scale biodiversity mapping of the tallest “canopy” species enable researchers to focus their attention — and budgets — on things that can be done better on the ground, according to Miles Silman, a biology professor at Wake Forest University in North Carolina who is studying the shift in tree ranges on the eastern slope of the Andes Mountains in Peru.
Still, some researchers question whether this approach is ready for prime time.
“It’s still early,” says Matthew Hansen, a remote sensing scientist at the University of Maryland. The challenge, Hansen says, will be “moving from research to operations,” where the technology must “be accurate over large scales, repeatable and affordable.”
At some $2.5 million per year, not counting the flying, Asner’s airborne mapping project is pricey, but he is working on automating the system so it can be mounted on a satellite, which would increase coverage and lower costs.
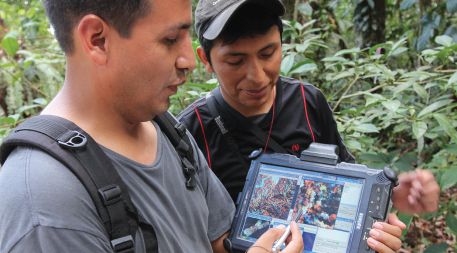
Field team members Raúl Tupayachi (left) and Felipe Sinca use data from Gred Asner’s spectrometer-equipped plane mapping to home in on a specific tree. A member of the team will climb the tree and lop of a branch and the chemical content of the leaves will be analyzed to help calibrate the spectrometer. Photo by Barbara Fraser.
Meanwhile, to make the most of his budget, the plane also carries laser-guided remote-sensing equipment that measures biomass, allowing Asner to calculate the amount of carbon stored in tropical forests. That data can help the countries where he works — including Panama, Colombia and Madagascar, in addition to Peru — negotiate carbon-credit schemes to finance their conservation plans.
Ultimately, Asner hopes his efforts will help the government agencies make the tough conservation decisions that will be needed in a warming world.Asner also extends the reach of his work by providing government agencies with the software his group has developed to monitor deforestation and forest degradation using satellite images. The Carnegie Institution plans to offer free online training on the software — dubbed CLASlite — through Stanford, with a course in English scheduled to begin in early December and a Spanish course expected in 2014. Participants will receive copies of the software, which they can use to do their own forest monitoring.
Ultimately, Asner hopes his efforts will help the government agencies make the tough conservation decisions that will be needed in a warming world.
“The western amazon is the hottest of hot spots, in the sense that it has so many environments and those environments have produced so many species,” Asner says. “Our key contribution [to conservation] rests on understanding the geography of the western Amazon’s biodiversity, how that connects to the environmental conditions and what’s missing in the conservation portfolio.”
![]()
Ensia shares solutions-focused stories free of charge through our online magazine and partner media. That means audiences around the world have ready access to stories that can — and do — help them shape a better future. If you value our work, please show your support today.
Yes, I'll support Ensia!