
Let’s talk about labor-force participation.
No, really.
For decades, this number slumbered quietly in the depths of the monthly jobs report from the US Bureau of Labor Statistics (BLS). Nobody paid it much attention. But of late—and particularly in the run-up to today’s Congressional election—it has become a key talking point for critics of president Barack Obama’s economic policies.
The chart does indeed look pretty ugly, with a decline since the late 1990s that becomes especially striking in the late 2000s. In econometric circles this is what’s known as a “frowny face.”
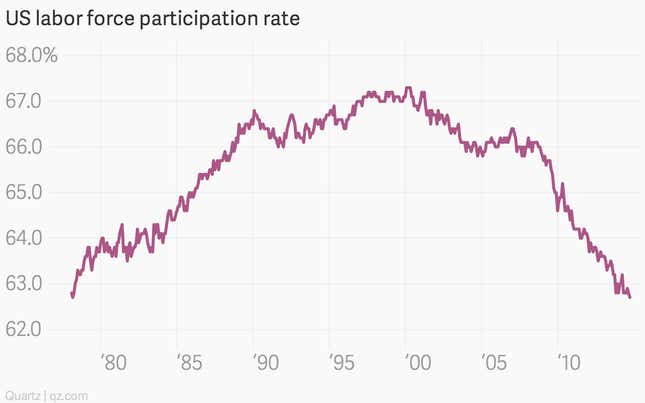
Actually that was a joke. It’s not really called a frowny face. But it might as well be. In September, the US labor participation rate fell to 62.7%, the lowest since the US economic malaise under president Jimmy Carter in the late 1970s.
That looks pretty bad. But to understand why this number is important, you have to understand what people think it says—and what it actually says.
Critics of Obama think it shows that his supposedly liberal policies are damaging the economy and prompting Americans to drop out of the job market en masse. They think it shows the Democratic neo-welfare state this president constructed is rewarding laziness by doling out government handouts. They think it somehow shows that the sharp decline in the US unemployment rate is a fraud.
But it doesn’t show these things. All it shows is that the labor force—the number of people either employed or “actively looking for work”—is a shrinking share of the US population. In absolute terms, the labor force could be shrinking, or it could just be growing more slowly than the population as a whole. So which is it?
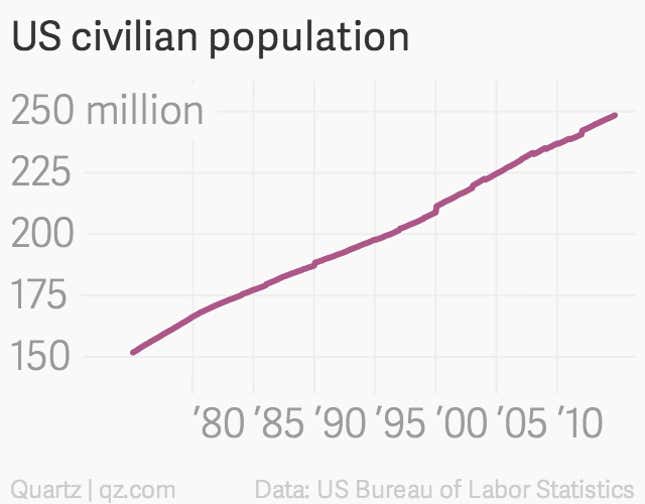
Well, as the first of these small charts shows, the civilian population—that is to say, over-16s who aren’t in institutions such as prison or on active military duty—is growing at much the same rate as always. It reached 248.5 million in September, up roughly 1% from a year ago.
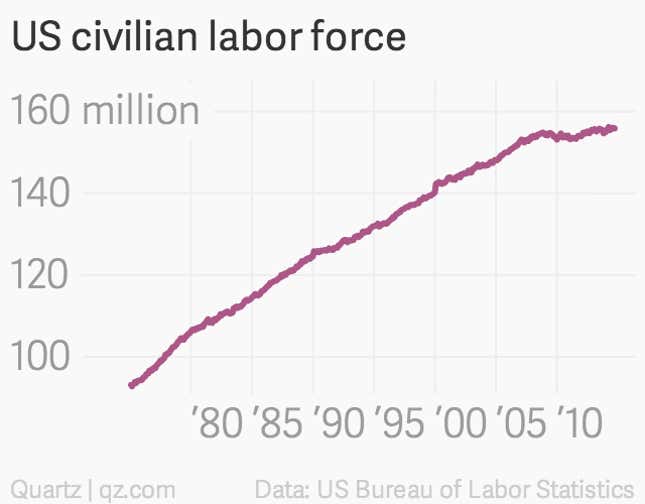
The second chart is the civilian labor force, going back to the late 1970s. It’s still growing, but growth has flattened out quite a bit over the last five years. Correspondingly (third chart), the number of people alive but not in the labor force is rising at an accelerating pace.
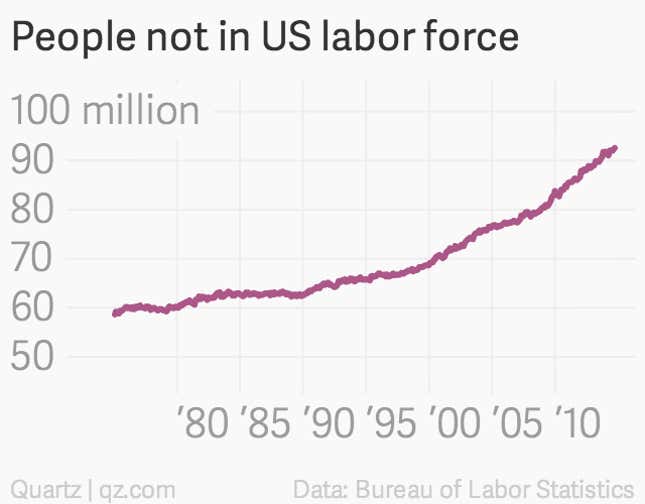
Why is this? The non-partisan Congressional Budget Office (CBO) suggests that there’s a pretty clear reason. “An unusually large number of people have stopped looking for work,” CBO analysts wrote in a broad-based analysis of the labor market published back in February (pdf).
So that means the critics of the administration are right, and people are dropping out of the labor force at an unprecedented pace? Not so fast. A lot of the people dropping out of the labor force are just, well, old. That’s because the demographic bulge known as the baby boom generation is aging out of the workforce.
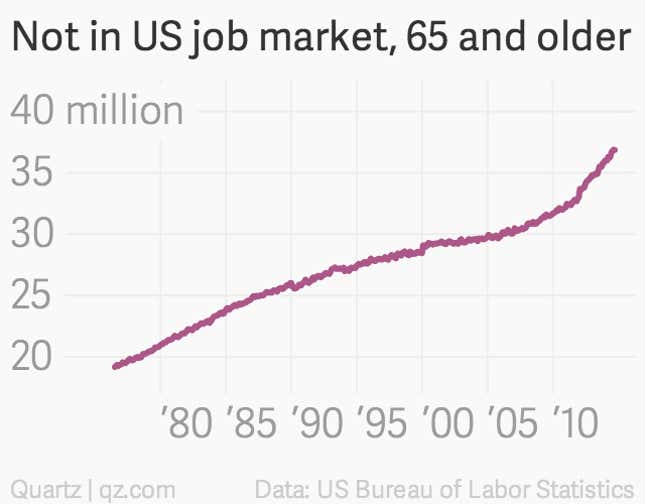
You see this in the fourth chart, showing a sharp surge in people over 65 who are out of the labor force. There are roughly 37 million of them, and more than 50 million who are over 55.
The cumulative effect of all these people aging out of the work force is to lower the participation rate. The CBO says that roughly half of the three-percentage-point decline in labor-force participation since the end of 2007 is due to the aging of the workforce. (For the record, it’s not just the CBO. A range of other papers—here, here, and here for example—have come up with similar results. Of course, not everybody agrees.)
How the other half lives
So if half the fall in labor-force participation since the recession is demographic, what about the other half? Well, one percentage point of the decline is related to temporary factors related to the business cycle, the CBO says. That leaves half a percentage point to account for.
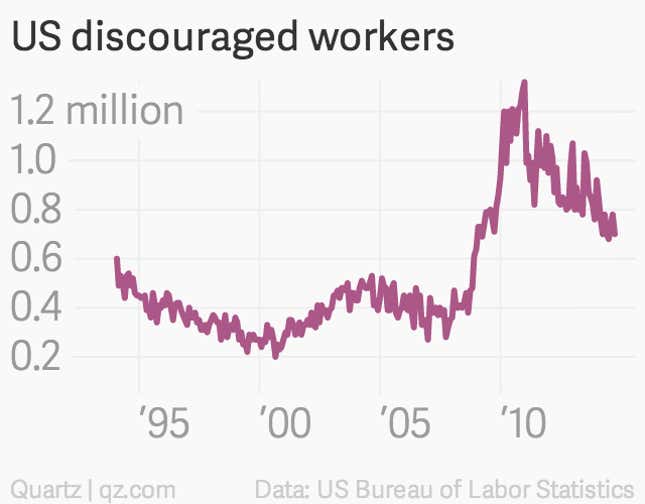
This is where the critics of Obama—to the extent that he actually is responsible for the slow pace of recovery—might appear to have a legitimate point. Some folks do appear to have dropped out of the workforce all together. The BLS counts a category of people called discouraged workers (fifth chart)—those who haven’t looked for a job in the past four weeks, specifically because they believe there aren’t any jobs for them. Even though they want work, these people aren’t counted as part of the labor force because they’re not actively looking.
And, indeed, years into the economic recovery, the number of discouraged workers remains high. This is related to “unusual aspects of the slow recovery that led workers to become discouraged and permanently drop out of the labor force,” wrote the CBO.
However, this may not be all that surprising, given the depth of the recession, which was preceded by the worst financial panic in nearly a century. And since 2010 the number of discouraged workers has been declining, a sign that the ongoing improvement in the economy is beginning to coax more workers back into employment.
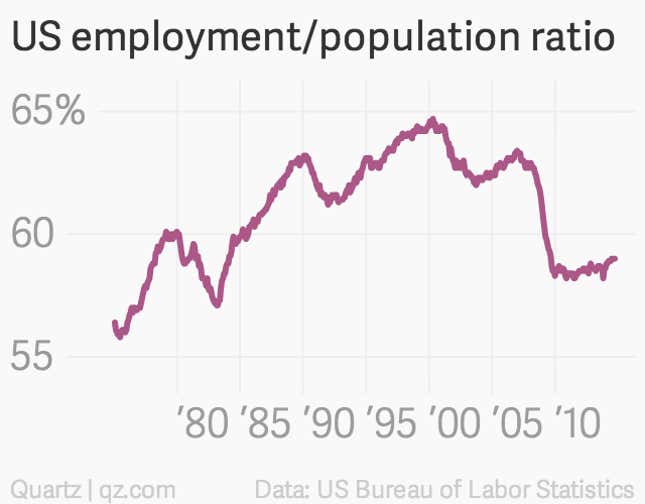
Here’s another sign of that. Let’s look at the employment-to-population ratio. This is simply the share of the civilian population who have jobs. (As a reminder, labor-force participation is the share of the population who have jobs or are actively looking.) If you look at the overall data—the sixth chart—the falloff looks pretty drastic and the recovery pretty anemic.
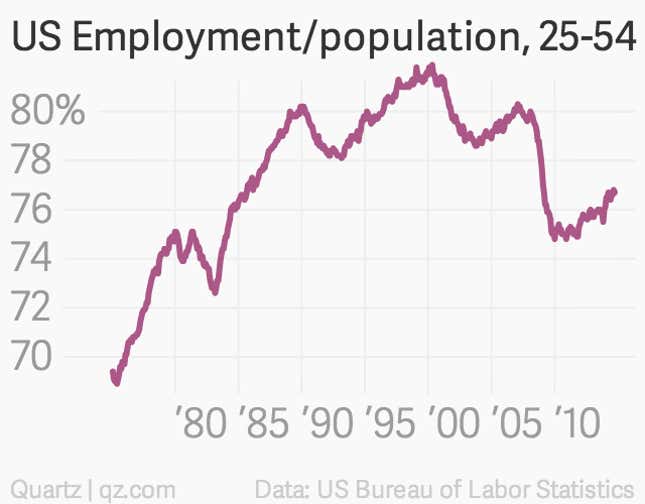
But now let’s look at the same data, but confine it to just people in their prime working years, aged 25 to 54—the seventh chart. This helps us strip out the surging ranks of older baby-boomers. It also strips out the ranks of those between the ages of 16 and 24, where increasing college attendance has been decreasing employment participation fairly steadily for at least 15 years. Both those groups can skew the numbers.
So when you look at this prime working-age population, you can see that, after the sharp collapse back in 2008, things have been improving steadily over the last few years, though there’s clearly still a way to go.
The wrong number to use anyway
Now, even if the US economy continues improving—as most expect—it doesn’t mean that labor-force participation will rebound. Rather, it’s likely to keep declining for at least the next 10 years, as the baby-boomers continue to age out of the workforce. (CBO estimates that labor force participation will be at 60.8% in 2024.)
Without another giant baby boom, it will most likely never to return to the peaks seen during the late 1990s, no matter what political party is in charge. As a measure of whether Americans who should be working are working, the employment-to-population ratio for people of prime working age is much more useful.
In other words, you should stop talking about labor-force participation. After all, Obama’s conservative critics will do just that if one of their own takes over the White House in 2016.