In recent years, data and business intelligence in general has become an important part of business success. More and more business owners and teams are now relying on data more than ever before in order to make better decisions about customers, products, and systems. The problem is, data analysis doesn’t come very easy to most people. Unless you’re an experienced data scientist or a mathematician, it can be hard to interpret thousands of rows of data in a spreadsheet. Fortunately, there are a lot of great tools out there that can help make data analysis a lot easier.
Here are seven data visualization and business intelligence tools that you can use in order to make better decisions about the future of your company or organization:
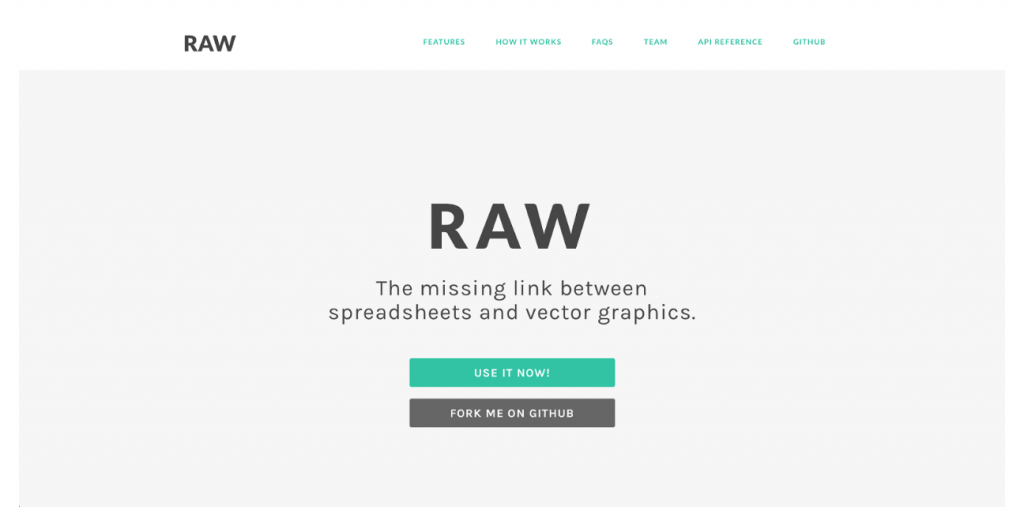
RAW positions itself as “the missing link between spreadsheets and vector graphics. The tools allows users to create and export visualizations in vector (SVG) or raster (PNG) format and embed them into a web page. The process is really simple: all you have to do is import or copy/paste your data into RAW, choose a layout, map your dimensions, customize as you see fit, and then export your finalized visualization.
Cost: Free
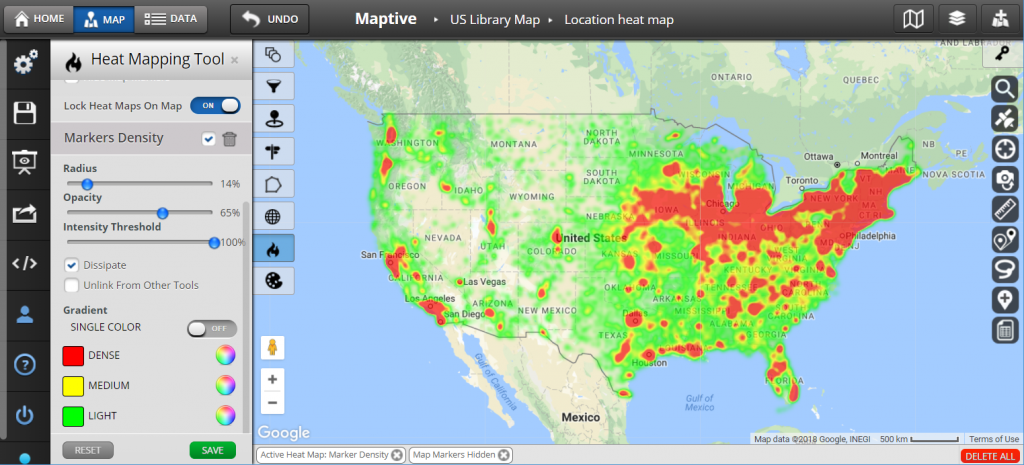
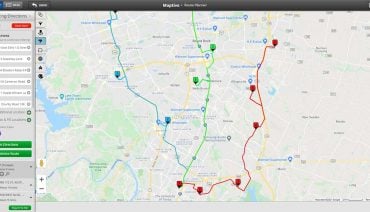
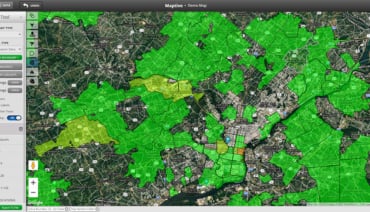
We couldn’t make a list about data visualization tools without taking the time to mention Maptive! With Maptive, you can transform raw location data into a beautiful, customized Google map in only a matter of seconds. Our elegant software was designed to make mapping simple and fast for everyone—no matter their skill level. The process is simple: paste or upload your data from an existing spreadsheet, decide how you want your map to look, then hit the “Map Now” and your customized Google map will be created within a matter of seconds. Once created, you can decide whether you want to add further customization to your map, how you want certain information to be displayed, and how you want to share your map.
Cost: Both free and paid plans are available
Try it For Free!!
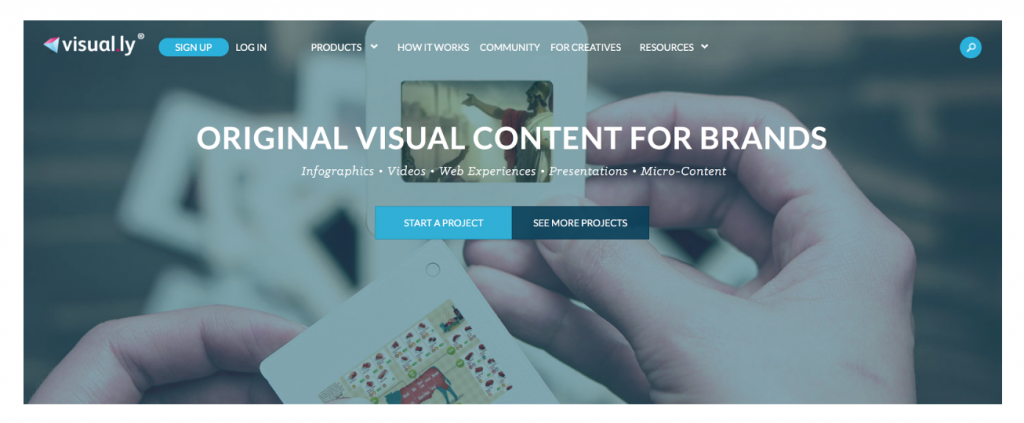
Visual.ly is a service you can use to create a number of different types of visual content for your business or organization, such as infographics, videos, presentations, and other micro-content. The process is fairly straightforward: you start by going to the site and filling out a creative brief, then you get connected with one or more creative professionals who can help you with your project. Throughout the process you use the tools within the Visual.ly dashboard to provide feedback, collaborate with others, and keep the project moving forward. Once your piece of content is finalized, you can launch and share as you please.
Cost: Varies depending on your project and needs
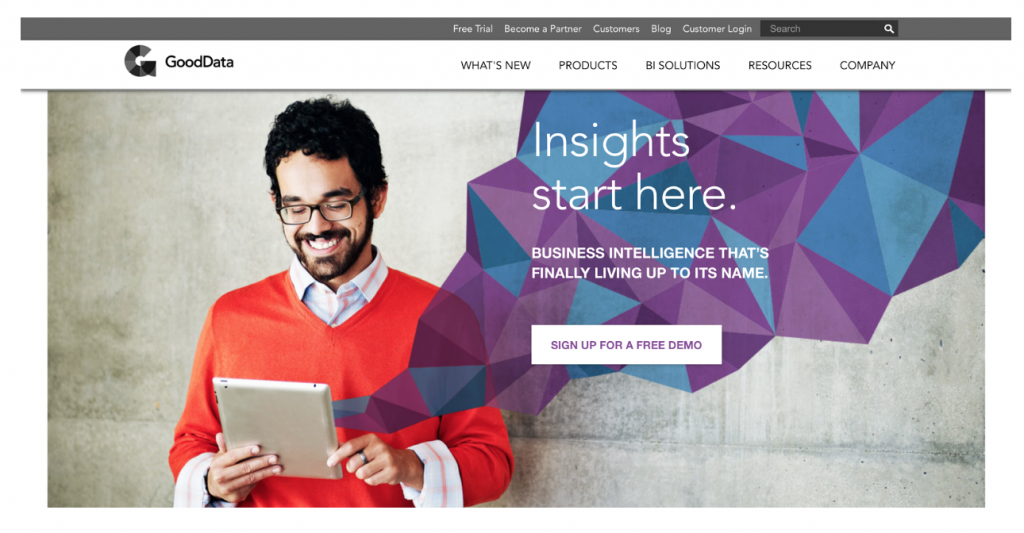
GoodData is a cloud-based business intelligence and analytics platform that promotes visual data discovery, exploration, and collaboration. Business intelligence tools like GoodData make it easy to transform raw data into meaningful and useful information for business analysis purposes. GoodData offers business intelligence solutions that you can use internally as a way to make better decisions about your company, or externally as a way to better inform your customers. You can learn more about their platform by visiting this page on their site.
Cost: Free trial available
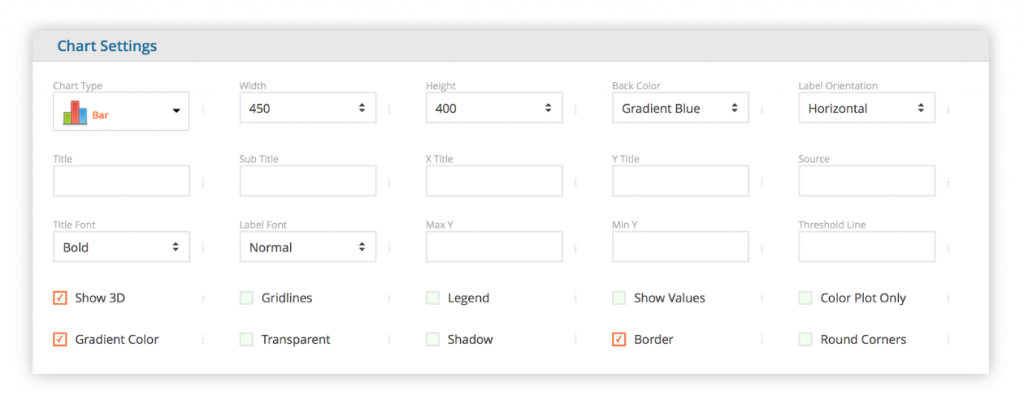
ChartGo allows you to quickly make simple charts online. All you have to do is choose your settings, enter your data, and hit create. With ChartGo, you have the ability to make graphs, bar charts, line charts, pie charts, and area charts. Once your chart has been created, you can download it as an image, print it, or go back and customize it further as needed.
Cost: Free
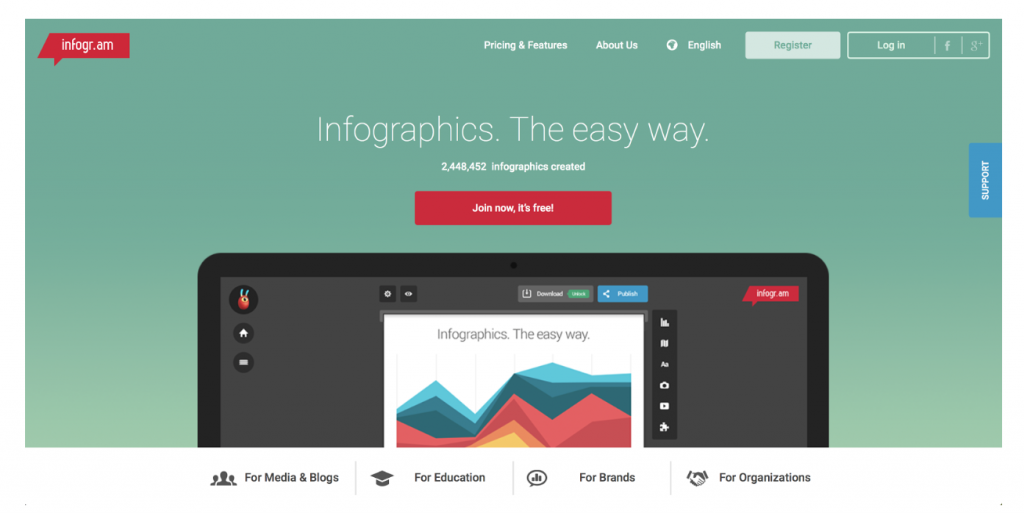
As stated on their website, Infogr.am is an easy app for creating infographics on the web. With Infogr.am, you can build real-time, interactive, beautiful, shareable, embeddable and downloadable infographics using more than 30 chart types, text objects, videos, images and maps. Getting started is easy. All you have to do is go to the homepage, create an account by registering with your email or through one of your social accounts. Once your account has been created, you simply hit the “Create” button to start building your graphic.
Cost: Both free and paid plans are available
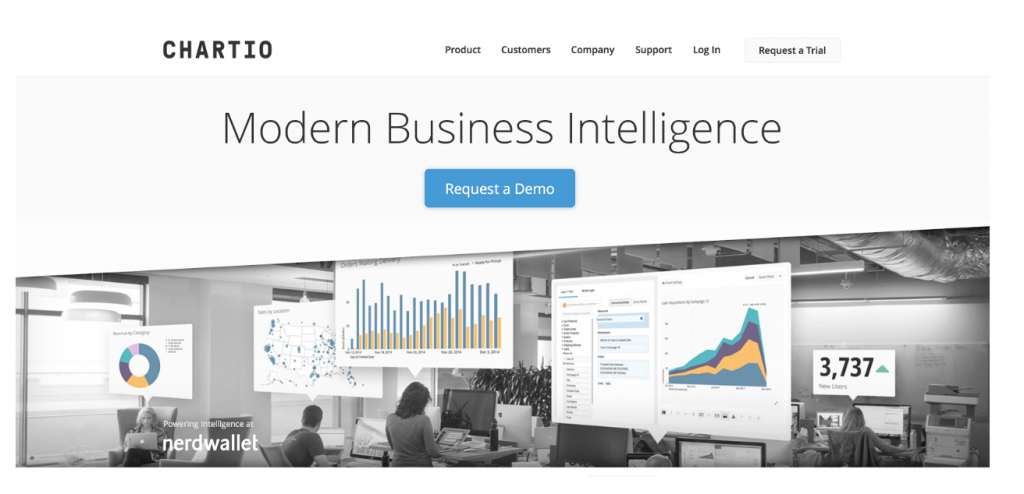
Chartio is another easy-to-use cloud-based business intelligence and analytics platform. With Chartio, you can create interactive charts and data dashboards through an intuitive drag and drop interface. Charts can be accessed from anywhere and from any device, and once created, any chart can be saved as a PNG image, PDF, or CSV. You can learn more about the Chartio platform by visiting this page on their website.
Cost: Varies depending on your needs