
Computational drug repositioning based on side-effects mined from social media
- Published
- Accepted
- Received
- Academic Editor
- Sebastian Ventura
- Subject Areas
- Bioinformatics, Data Mining and Machine Learning, Computational Biology, Social Computing
- Keywords
- Drug repositioning, Drug repurposing, Side-effect, Adverse drug reaction, Social media, Graphical model, Graphical lasso, Inverse covariance estimation
- Copyright
- © 2016 Nugent et al.
- Licence
- This is an open access article distributed under the terms of the Creative Commons Attribution License, which permits unrestricted use, distribution, reproduction and adaptation in any medium and for any purpose provided that it is properly attributed. For attribution, the original author(s), title, publication source (PeerJ Computer Science) and either DOI or URL of the article must be cited.
- Cite this article
- 2016. Computational drug repositioning based on side-effects mined from social media. PeerJ Computer Science 2:e46 https://doi.org/10.7717/peerj-cs.46
Abstract
Drug repositioning methods attempt to identify novel therapeutic indications for marketed drugs. Strategies include the use of side-effects to assign new disease indications, based on the premise that both therapeutic effects and side-effects are measurable physiological changes resulting from drug intervention. Drugs with similar side-effects might share a common mechanism of action linking side-effects with disease treatment, or may serve as a treatment by “rescuing” a disease phenotype on the basis of their side-effects; therefore it may be possible to infer new indications based on the similarity of side-effect profiles. While existing methods leverage side-effect data from clinical studies and drug labels, evidence suggests this information is often incomplete due to under-reporting. Here, we describe a novel computational method that uses side-effect data mined from social media to generate a sparse undirected graphical model using inverse covariance estimation with ℓ1-norm regularization. Results show that known indications are well recovered while current trial indications can also be identified, suggesting that sparse graphical models generated using side-effect data mined from social media may be useful for computational drug repositioning.
Introduction
Drug repositioning is the process of identifying novel therapeutic indications for marketed drugs. Compared to traditional drug development, repositioned drugs have the advantage of decreased development time and costs given that significant pharmacokinetic, toxicology and safety data will have already been accumulated, drastically reducing the risk of attrition during clinical trials. In addition to marketed drugs, it is estimated that drug libraries may contain upwards of 2,000 failed drugs that have the potential to be repositioned, with this number increasing at a rate of 150–200 compounds per year (Jarvis, 2006). Repositioning of marketed or failed drugs has opened up new sources of revenue for pharmaceutical companies with estimates suggesting the market could generate multi-billion dollar annual sales in coming years (Thomson Reuters, 2012; Tobinick, 2009). While many of the current successes of drug repositioning have come about through serendipitous clinical observations, systematic data-driven approaches are now showing increasing promise given their ability to generate repositioning hypotheses for multiple drugs and diseases simultaneously using a wide range of data sources, while also incorporating prioritisation information to further accelerate development time (Hurle et al., 2013). Existing computational repositioning strategies generally use similar approaches but attempt to link different concepts. They include the use of transcriptomics methods which compare drug response gene-expression with disease gene-expression signatures (Lamb et al., 2006; Hu & Agarwal, 2009; Iorio et al., 2010; Sirota et al., 2011; Dudley et al., 2011), genetics-based methods which connect a known drug target with a genetically associated phenotype (Franke et al., 2010; Zhang et al., 2015; Wang & Zhang, 2013; Sanseau et al., 2012; Wang et al., 2015), network-based methods which link drugs or diseases in a network based on shared features (Krauthammer et al., 2004; Barabasi, Gulbahce & Loscalzo, 2011; Kohler et al., 2008; Vanunu et al., 2010; Emig et al., 2013), and methods that use side-effect similarity to infer novel indications (Campillos et al., 2008; Yang & Agarwal, 2011; Zhang et al., 2013; Cheng et al., 2013; Bisgin et al., 2012; Duran-Frigola & Aloy, 2012; Wang et al., 2014; Ye, Liu & Wei, 2014).
Drug side-effects can be attributed to a number of molecular interactions including on or off-target binding, drug–drug interactions (Vilar et al., 2014; Tatonetti et al., 2012), dose-dependent pharmacokinetics, metabolic activities, downstream pathway perturbations, aggregation effects, and irreversible target binding (Xie et al., 2012; Campillos et al., 2008). While side-effects are considered the unintended consequence of drug intervention, they can provide valuable insight into the physiological changes caused by the drug that are difficult to predict using pre-clinical or animal models. This relationship between drugs and side-effects has been exploited and used to identify shared target proteins between chemically dissimilar drugs, allowing new indications to be inferred based on the similarity of side-effect profiles (Campillos et al., 2008). One rationale behind this and related approaches is that drugs sharing a significant number of side-effects might share a common mechanism of action linking side-effects with disease treatment—side-effects essentially become a phenotypic biomarker for a particular disease (Yang & Agarwal, 2011; Duran-Frigola & Aloy, 2012). Repositioned drugs can also be said to “rescue” a disease phenotype, on the basis of their side-effects; for example, drugs which cause hair growth as a side-effect can potentially be repositioned for the treatment of hair loss, while drugs which cause hypotension as a side-effect can be used to treat hypertension (Yang & Agarwal, 2011). Examples of drugs successfully repositioned based on phenotypic rescue that have made it to market include exenatide, which was shown to cause significant weight loss as a side-effect of type 2 diabetes treatment, leading to a trial of its therapeutic effect in non-diabetic obese subjects (Buse et al., 2004; Ladenheim, 2015), minoxidil which was originally developed for hypertension but found to cause hair growth as a side-effect, leading to its repositioning for the treatment of hair loss and androgenetic alopecia (Shorter et al., 2008; Li et al., 2001), and, perhaps most famously, sildenafil citrate which was repositioned while being studied for the primary indication of angina to the treatment of erectile dysfunction (Ghofrani, Osterloh & Grimminger, 2006).
Existing repositioning methods based on side-effects, such as the work of Campillos et al. (2008) and Yang & Agarwal (2011), have used data from the SIDER database (Kuhn et al., 2010), which contains side-effect data extracted from drug labels, largely collected from clinical trials during the pre-marketing phase of drug development. Other resources include Meyler’s Side Effects of Drugs (Aronson, 2015), which is updated annually in the Side Effects of Drugs Annual (Ray, 2014), and the Drugs@FDA database (US Food and Drug Administraction, 2016), while pharmacovigilance authorities attempt to detect, assess and monitor reported drug side-effects post-market. Despite regular updates to these resources and voluntary reporting systems, there is evidence to suggest that side-effects are substantially under-reported, with some estimates indicating that up to 86% of adverse drug reactions go unreported for reasons that include lack of incentives, indifference, complacency, workload and lack of training among healthcare professionals (Backstrom, Mjorndal & Dahlqvist, 2004; Lopez-Gonzalez, Herdeiro & Figueiras, 2009; Hazell & Shakir, 2006; Tandon et al., 2015). Side-effects reported from clinical trials also have limitations due to constraints on scale and time, as well as pharmacogenomic effects (Evans & McLeod, 2003). A number of cancer drug studies have also observed that women are often significantly under-represented in clinical trials, making it difficult to study the efficacy, dosing and side-effects of treatments which can work differently in women and men; similar problems of under-representation also affect paediatrics, as many drugs are only ever tested on adults (Jones, 2009).
Recently, efforts to mine user-generated content and social media for public-health issues and side-effects have shown promising performance, demonstrating correlations between the frequency of side-effects extracted from unlabelled data and the frequency of documented adverse drug reactions (Leaman et al., 2010). Despite this success, a number of significant natural language processing challenges remain. These include dealing with idiomatic expressions, linguistic variability of expression and creativity, ambiguous terminology, spelling errors, word shortenings, and distinguishing between the symptoms that a drug is treating and the side-effects it causes. Some of the solutions proposed to deal with these issues include the use of specialist lexicons, appropriate use of semantic analysis, and improvements to approximate string matching, modeling of spelling errors, and contextual analysis surrounding the mentions of side-effects (Leaman et al., 2010; Segura-Bedmar et al., 2015), while maintaining a list of symptoms for which a drug is prescribed can help to eliminate them from the list of side-effects identified (Sampathkumar, Chen & Luo, 2014). Although much of the focus has explored the use of online forums where users discuss their experience with pharmaceutical drugs and report side-effects (Chee, Berlin & Schatz, 2011), the growing popularity of Twitter (2015), which at the time of writing has over 300 million active monthly users, provides a novel resource upon which to perform large-scale mining of reported drug side-effects in near real-time from the 500 millions tweets posted daily (Internet Live Stats, 2015). While only a small fraction of these daily tweets are related to health issues, the sheer volume of data available presents an opportunity to bridge the gap left by conventional side-effects reporting strategies. Over time, the accumulation of side-effect data from social media may become comparable or even exceed the volume of traditional resources, and at the very least should be sufficient to augment existing databases. Additionally, the cost of running such a system continuously is relatively cheap compared to existing pharmacovigilance monitoring, presenting a compelling economic argument supporting the use of social media for such purposes. Furthermore, the issues related to under-representation described above may be addressed.
Freifeld et al. (2014) presented a comparison study between drug side-effects found on Twitter and adverse events reported in the FDA Adverse Event Reporting System (FAERS). Starting with 6.9 million tweets, they used a set of 23 drug names and a list of symptoms to reduce that data to a subset of 60,000 tweets. After manual examination, there were 4,401 tweets identified as mentioning a side-effect, with a Spearman rank correlation found to be 0.75. Nikfarjam et al. (2015) introduce a method based on Conditional Random Fields (CRF) to tag mentions of drug side-effects in social media posts from Twitter or the online health community DailyStrength. They use features based on the context of tokens, a lexicon of adverse drug reactions, Part-Of-Speech (POS) tags and a feature indicating whether a token is negated or not. They also used embedding clusters learned with Word2Vec (Mikolov et al., 2013). They reported an F1 score of 82.1% for data from DailyStrength and 72.1% for Twitter data. Sarker & Gonzalez (2015) developed classifiers to detect side-effects using training data from multiple sources, including tweets (Ginn et al., 2014), DailyStrength, and a corpus of adverse drug events obtained from medical case reports. They reported an F1 score of 59.7% when training a Support Vector Machine (SVM) with Radial Basis Function (RBF) kernel on all three datasets. Recently, Karimi et al. (2015) presented a survey of the field of surveillance for adverse drug events with automatic text and data mining techniques.
In this study, we describe a drug repositioning methodology that uses side-effect data mined from social media to infer novel indications for marketed drugs. We use data from a pharmacovigilance system for mining Twitter for drug side-effects (Plachouras, Leidner & Garrow, under review). The system uses a set of cascading filters to eliminate large quantities of irrelevant messages and identify the most relevant data for further processing, before applying a SVM classifier to identify tweets that mention suspected adverse drug reactions. Using this data we apply sparse inverse covariance estimation to construct an undirected graphical model, which offers a way to describe the relationship between all drug pairs (Meinshausen & Bühlmann, 2006; Friedman, Hastie & Tibshirani, 2008; Banerjee, ElGhaoui & d’Aspremont, 2008). This is achieved by solving a maximum likelihood problem using ℓ1-norm regularization to make the resulting graph as sparse as possible, in order to generate the simplest graphical model which fully explains the data. Results from testing the method on known and proposed trial indication recovery suggest that side-effect data mined from social media in combination with a regularized sparse graphical model can be used for systematic drug repositioning.
Methods
Mining Twitter for drug side-effects
We used the SoMeDoSEs pharmacovigilance system (Plachouras, Leidner & Garrow, under review) to extract reports of drug side-effects from Twitter over a 6 month period between January and June 2014. SoMeDoSEs works by first applying topic filters to identify tweets that contain keywords related to drugs, before applying volume filters which remove tweets that are not written in English, are re-tweets or contain a hyperlink to a web page, since these posts are typically commercial offerings. Side-effects were then mapped to an entry in the FDA Adverse Event Reporting System. Tweets that pass these filters are then classified by a linear SVM to distinguish those that mention a drug side-effect from those that do not. The SVM classifier uses a number of natural language features including unigrams and bigrams, part-of-speech tags, sentiment scores, text surface features, and matches to gazetteers related to human body parts, side-effect synonyms, side-effect symptoms, causality indicators, clinical trials, medical professional roles, side effect-triggers and drugs.
For each gazetteer, three features were created: a binary feature, which is set to 1 if a tweet contains at least one sequence of tokens matching an entry from the gazetteer, the number of tokens matching entries from the gazetteer, and the fraction of characters in tokens matching entries from the gazetteer. For side-effect synonyms we used the Consumer Health Vocabulary (CHV) (Zeng et al., 2005), which maps phrases to Unified Medical Language System concept universal identifiers (CUI) and partially addresses the issue of misspellings and informal language used to discuss medical issues in tweets. The matched CUIs were also used as additional features.
To develop the system, 10,000 tweets which passed the topic and volume filters were manually annotated as mentioning a side-effect or not, resulting in a Cohen’s Kappa for inter-annotator agreement on a sample of 404 tweets annotated by two non-healthcare professional of 0.535. Using a time-based split of 8,000 tweets for training, 1,000 for development, and 1,000 for testing, the SVM classifier that used all the features achieved a precision of 55.0%, recall of 66.9%, and F1 score of 60.4% when evaluated using the 1,000 test tweets. This is statistically significantly higher than the results achieved by a linear SVM classifier using only unigrams and bigrams as features (precision of 56.0%, recall of 54.0% and F1 score of 54.9%). One of the sources of false negatives was the use of colloquial and indirect expressions by Twitter users to express that they have experienced a side-effect. We also observed that a number of false positives discuss the efficacy of drugs rather than side-effects.
Twitter data
Over the 6 month period, SoMeDoSEs typically identified ∼700 tweets per day that mentioned a drug side-effect, resulting in a data set of 620 unique drugs and 2,196 unique side-effects from 108,009 tweets, once drugs with only a single side-effect were excluded and drug synonyms had been resolved to a common name using exact string matches to entries in World Drug Index (Thomson Reuters, 2015b), which worked for approximately half of the data set with the remainder matched manually. We were also careful to remove indications that were falsely identified as side-effects using drug indications from Cortellis Clinical Trials Intelligence (Thomson Reuters, 2015a). We used this data to construct a 2,196 row by 620 column matrix of binary variables X, where x ∈ {0, 1}, indicating whether each drug was reported to cause each side-effect in the Twitter data set.
Calculating the sample covariance matrix
Using this data, we are able to form the sample covariance matrix S for binary variables as follows (Allen, 1997), such that element Si,j gives the covariance of drug i with drug j: (1) where and xki is the k-th observation (side-effect) of variable (drug) Xi. It can be shown than the average product of two binary variables is equal to their observed joint probabilities such that: (2) where P(Xj = 1|Xi = 1) refers to the conditional probability that variable Xj equals one given that variable Xi equals one. Similarly, the product of the means of two binary variables is equal to the expected probability that both variables are equal to one, under the assumption of statistical independence: (3) Consequently, the covariance of two binary variables is equal to the difference between the observed joint probability and the expected joint probability: (4) Our objective is to find the precision or concentration matrix θ by inverting the sample covariance matrix S. Using θ, we can obtain the matrix of partial correlation coefficients ρ for all pairs of variables as follows: (5) The partial correlation between two variables X and Y given a third, Z, can be defined as the correlation between the residuals Rx and Ry after performing least-squares regression of X with Z and Y with Z, respectively. This value, denotated ρx,y|z, provides a measure of the correlation between two variables when conditioned on the third, with a value of zero implying conditional independence if the input data distribution is multivariate Gaussian. The partial correlation matrix ρ, however, gives the correlations between all pairs of variables conditioning on all other variables. Off-diagonal elements in ρ that are significantly different from zero will therefore be indicative of pairs of drugs that show unique covariance between their side-effect profiles when taking into account (i.e., removing) the variance of side-effects profiles amongst all the other drugs.
Shrinkage estimation
For the sample covariance matrix to be easily invertible, two desirable characteristics are that it should be positive definite, i.e., all eigenvalues should be distinct from zero, and well-conditioned, i.e., the ratio of its maximum and minimum singular value should not be too large. This can be particularly problematic when the sample size is small and the number of variables is large (n < p) and estimates of the covariance matrix become singular. To ensure these characteristics, and speed up convergence of the inversion, we condition the sample covariance matrix by shrinking towards an improved covariance estimator T, a process which tends to pull the most extreme coefficients towards more central values thereby systematically reducing estimation error (Ledoit & Wolf, 2003), using a linear shrinkage approach to combine the estimator and sample matrix in a weighted average: (6) where α ∈ {0, 1} denotes the analytically determined shrinkage intensity. We apply the approach of Schäfer and Strimmer, which uses a distribution-free, diagonal, unequal variance model which shrinks off-diagonal elements to zero but leaves diagonal entries intact, i.e., it does not shrink the variances (Schäfer & Strimmer, 2005). Shrinkage is actually applied to the correlations rather than the covariances, which has two distinct advantages: the off-diagonal elements determining the shrinkage intensity are all on the same scale, while the partial correlations derived from the resulting covariance estimator are independent of scale.
Graphical lasso for sparse inverse covariance estimation
A useful output from the covariance matrix inversion is a sparse ρ matrix containing many zero elements, since, intuitively, we know that relatively few drug pairs will share a common mechanism of action, so removing any spurious correlations is desirable and results in a more parsimonious relationship model, while the non-zero elements will typically reflect the correct positive correlations in the true inverse covariance matrix more accurately (Jones et al., 2012). However, elements of ρ are unlikely to be zero unless many elements of the sample covariance matrix are zero. The graphical lasso (Friedman, Hastie & Tibshirani, 2008; Banerjee, ElGhaoui & d’Aspremont, 2008; Hastie, Tibshirani & Wainwright, 2015) provides a way to induce zero partial correlations in ρ by penalizing the maximum likelihood estimate of the inverse covariance matrix using an ℓ1-norm penalty function. The estimate can be found by maximizing the following log-likelihood using the block coordinate descent approach described by Friedman, Hastie & Tibshirani (2008): (7) Here, the first term is the Gaussian log-likelihood of the data, tr denotes the trace operator and ‖θ‖1 is the ℓ1-norm—the sum of the absolute values of the elements of θ, weighted by the non-negative tuning paramater λ. The specific use of the ℓ1-norm penalty has the desirable effect of setting elements in θ to zero, resulting in a sparse matrix, while the parameter λ effectively controls the sparsity of the solution. This contrasts with the use of an ℓ2-norm penalty which will shrink elements but will never reduce them to zero. While this graphical lasso formulation is based on the assumption that the input data distribution is multivariate Gaussian, Banerjee, ElGhaoui & d’Aspremont (2008) showed that the dual optimization solution also applies to binary data, as is the case in our application.
It has been noted that the graphical lasso produces an approximation of θ that is not symmetric, so we update it as follows (Sustik & Calderhead, 2012): (8) The matrix ρ is then calculated according to Eq. (5), before repositioning predictions for drug i are determined by ranking all other drugs according to their absolute values in ρi and assigning their indications to drug i.
Results and Discussion
Recovering known indications
To evaluate our method we have attempted to predict repositioning targets for indications that are already known. If, by exploiting hindsight, we can recover these, then our method should provide a viable strategy with which to augment existing approaches that adopt an integrated approach to drug repositioning (Emig et al., 2013). Figure 1A shows the performance of the method at identifying co-indicated drugs at a range of λ values, resulting in different sparsity levels in the resulting ρ matrix. We measured the percentage at which a co-indicated drug was ranked amongst the top 5, 10, 15, 20 and 25 predictions for the target drug, respectively. Of the 620 drugs in our data set, 595 had a primary indication listed in Cortellis Clinical Trials Intelligence, with the majority of the remainder being made up of dietary supplements (e.g., methylsulfonylmethane) or plant extracts (e.g., Agaricus brasiliensis extract) which have no approved therapeutic effect. Rather than removing these from the data set, they were left in as they may contribute to the partial correlation between pairs of drugs that do have approved indications.
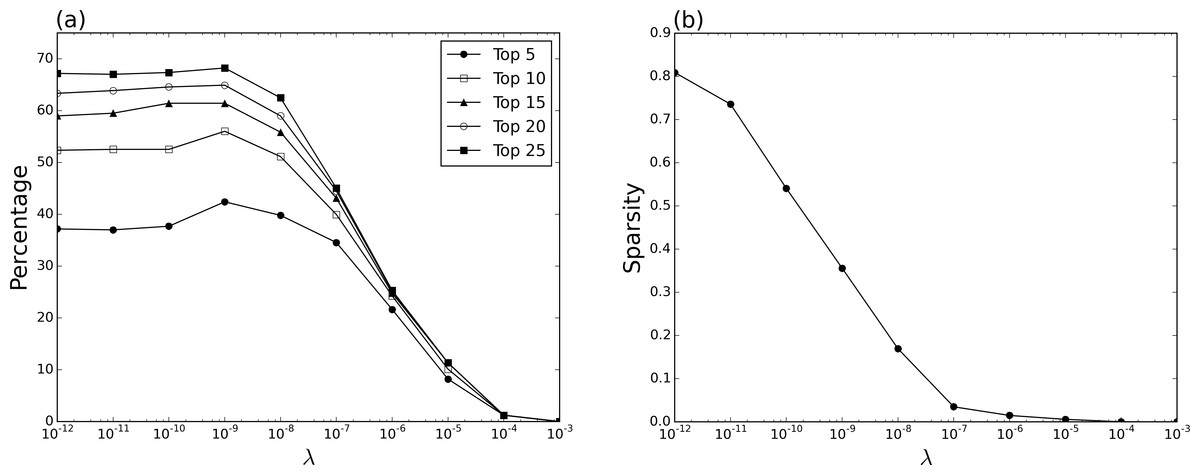
Figure 1: Recovery of known indications.
(A) Percentage at which a co-indicated drug is returned amongst the top 5, 10, 15, 20 and 25 ranked predictions for a given target, at different λ values—the parameter that weights the ℓ1-norm penalty in the graphical lasso (Eq. (7)). (B) Sparsity of ρ matrix at different λ values, i.e., the number of non-zero elements in the upper triangle divided by (n2 − n)/2.
Results indiciate that the method achieves its best performance with a λ value of 10−9 where 42.41% (243/595) of targets have a co-indicated drug returned amongst the top 5 ranked predictions (Fig. 1A). This value compares favourably with both a strategy in which drug ranking is randomized (13.54%, standard error ±0.65), and another in which drugs are ranked according to the Jaccard index (28.75%). In Ye, Liu & Wei (2014), a related approach is used to construct a repositioning network based on side-effects extracted from the SIDER database, Meyler’s Side Effects of Drugs, Side Effects of Drugs Annual, and the Drugs@FDA database (Kuhn et al., 2010; Aronson, 2015; Ray, 2014; US Food and Drug Administraction, 2016), also using the Jaccard index as the measure of drug–drug similarity. Here, they report an equivilent value of 32.77% of drugs having their indication correctly predicted amongst the top 5 results. While data sets and underlying statistical models clearly differ, these results taken together suggest that the use of side-effect data mined from social media can certainly offer comparable performance to methods using side-effect data extracted from more conventional resources, while the use of a global statistical model such as the graphical lasso does result in improved performance compared to a pairwise similarity coefficient such as the Jaccard index.
To further investigate the influence of the provenance of the data, we mapped our data set of drugs to ChEMBL identifiers (Gaulton et al., 2012; Bento et al., 2014) which we then used to query SIDER for side-effects extracted from drug labels. This resulted in a reduced data set of 229 drugs, in part due to the absence of many combination drugs from SIDER (e.g. the antidepressant Symbyax which contains olanzapine and fluoxetine). Using the same protocol described above, best performance of 53.67% (117/229) was achieved with a slightly higher λ value of 10−6. Best performance on the same data set using side-effects derived from Twitter was 38.43% (88/229), again using a λ value of 10−9, while the randomized strategy achieved 12.05% (standard error ± 1.14), indicating that the use of higher quality side-effect data from SIDER allows the model to achieve better performance than is possible using Twitter data. Perhaps more interestingly, combining the correct predictions between the two datasources reveals that 30 are unique to the Twitter model, 59 are unique to the SIDER model, with 58 shared, supporting the use side-effect data mined from social media to augment conventional resources.
We also investigated whether our results were biased by the over-representation of particular drug classes within our data set. Using Using Cortellis Clinical Trials Intelligence, we were able to identify the broad class for 479 of the drugs (77.26%) in our data set. The five largest classes were benzodiazepine receptor agonists (3/14 drugs returned amongst the top 5 ranked predictions), analgesics (6/12), H1-antihistamines (8/11), cyclooxygenase inhibitors (9/11), and anti-cancer (2/11). This indicates that the over-representation of H1-antihistamines and cyclooxygenase inhibitors did result in a bias, and to a lesser extent analgesics, but that the overall effect of these five classes was more subtle (28/59 returned amongst the top 5 ranked predictions, 47.46%).
The best performance of our approach at the top 5 level is achieved when the resulting ρ matrix has a sparsity of 35.59% (Figs. 1B and 2) which both justifies the use of the ℓ1-norm penalized graphical lasso, and generates a graphical model with approximately a third of the parameters of a fully dense matrix, while the comparable performance at λ values between 10−12 and 10−7 also indicates a degree of robustness to the choice of this parameter. Beyond the top 5 ranked predictions, results are encouraging as the majority of targets (56.02%) will have a co-indicated drug identified by considering only the top 10 predictions, suggesting the method is a feasible strategy for prioritisation of repositioning candidates.
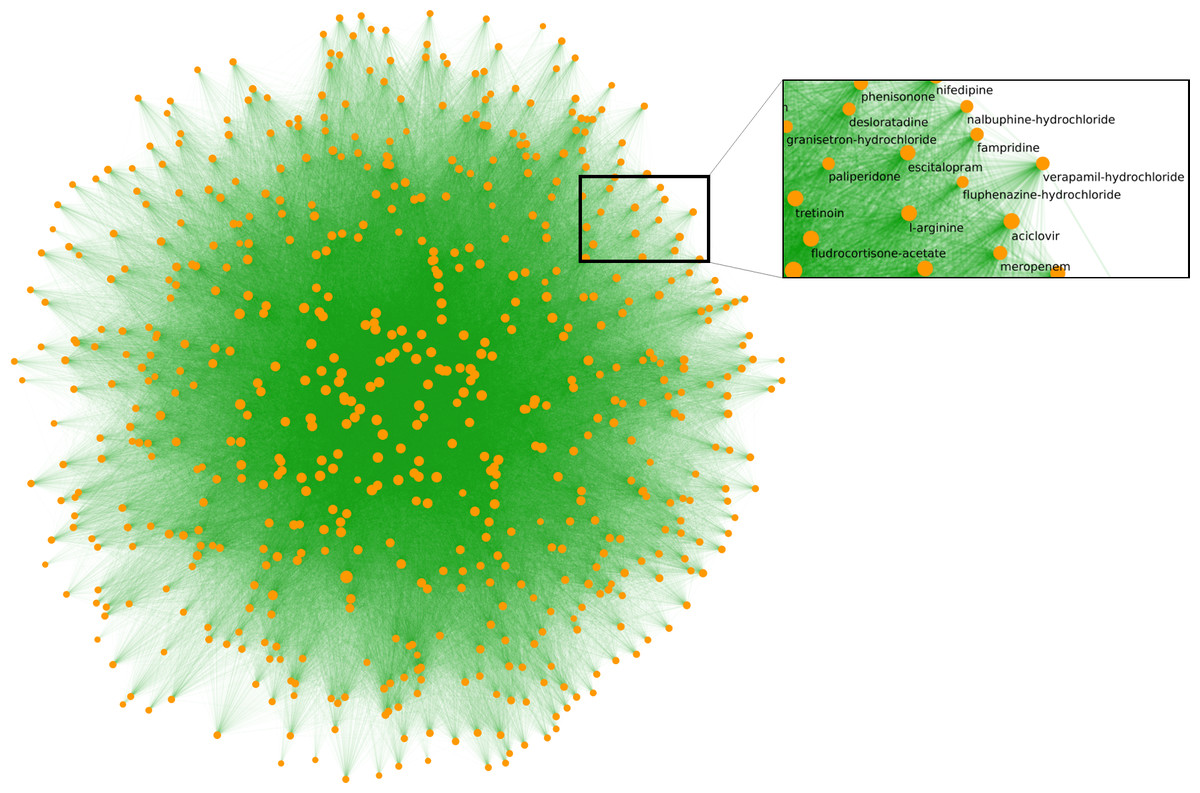
Figure 2: The overall layout of the side-effect network.
Drugs are yellow, connecting edges are green. The layout is performed using a relative entropy optimization-based method (Kovács, Mizsei & Csermely, 2014). In total, there are 616 connected nodes, with each having an average of 267 neighbours. Painkillers such as paracetamol and ibuprofen have the highest number of connections (587 and 585, respectively), which corresponds to them having the largest number of unique side-effects (256 and 224) reported on Twitter. The strongest connection is between chondroitin and glucosamine (partial correlation coefficient (PCC) 0.628), both of which are dietary supplements used to treat osteoarthritis, closely followed by the antidepressant and anxiolytic agents phenelzine and tranylcypromine (PCC 0.614).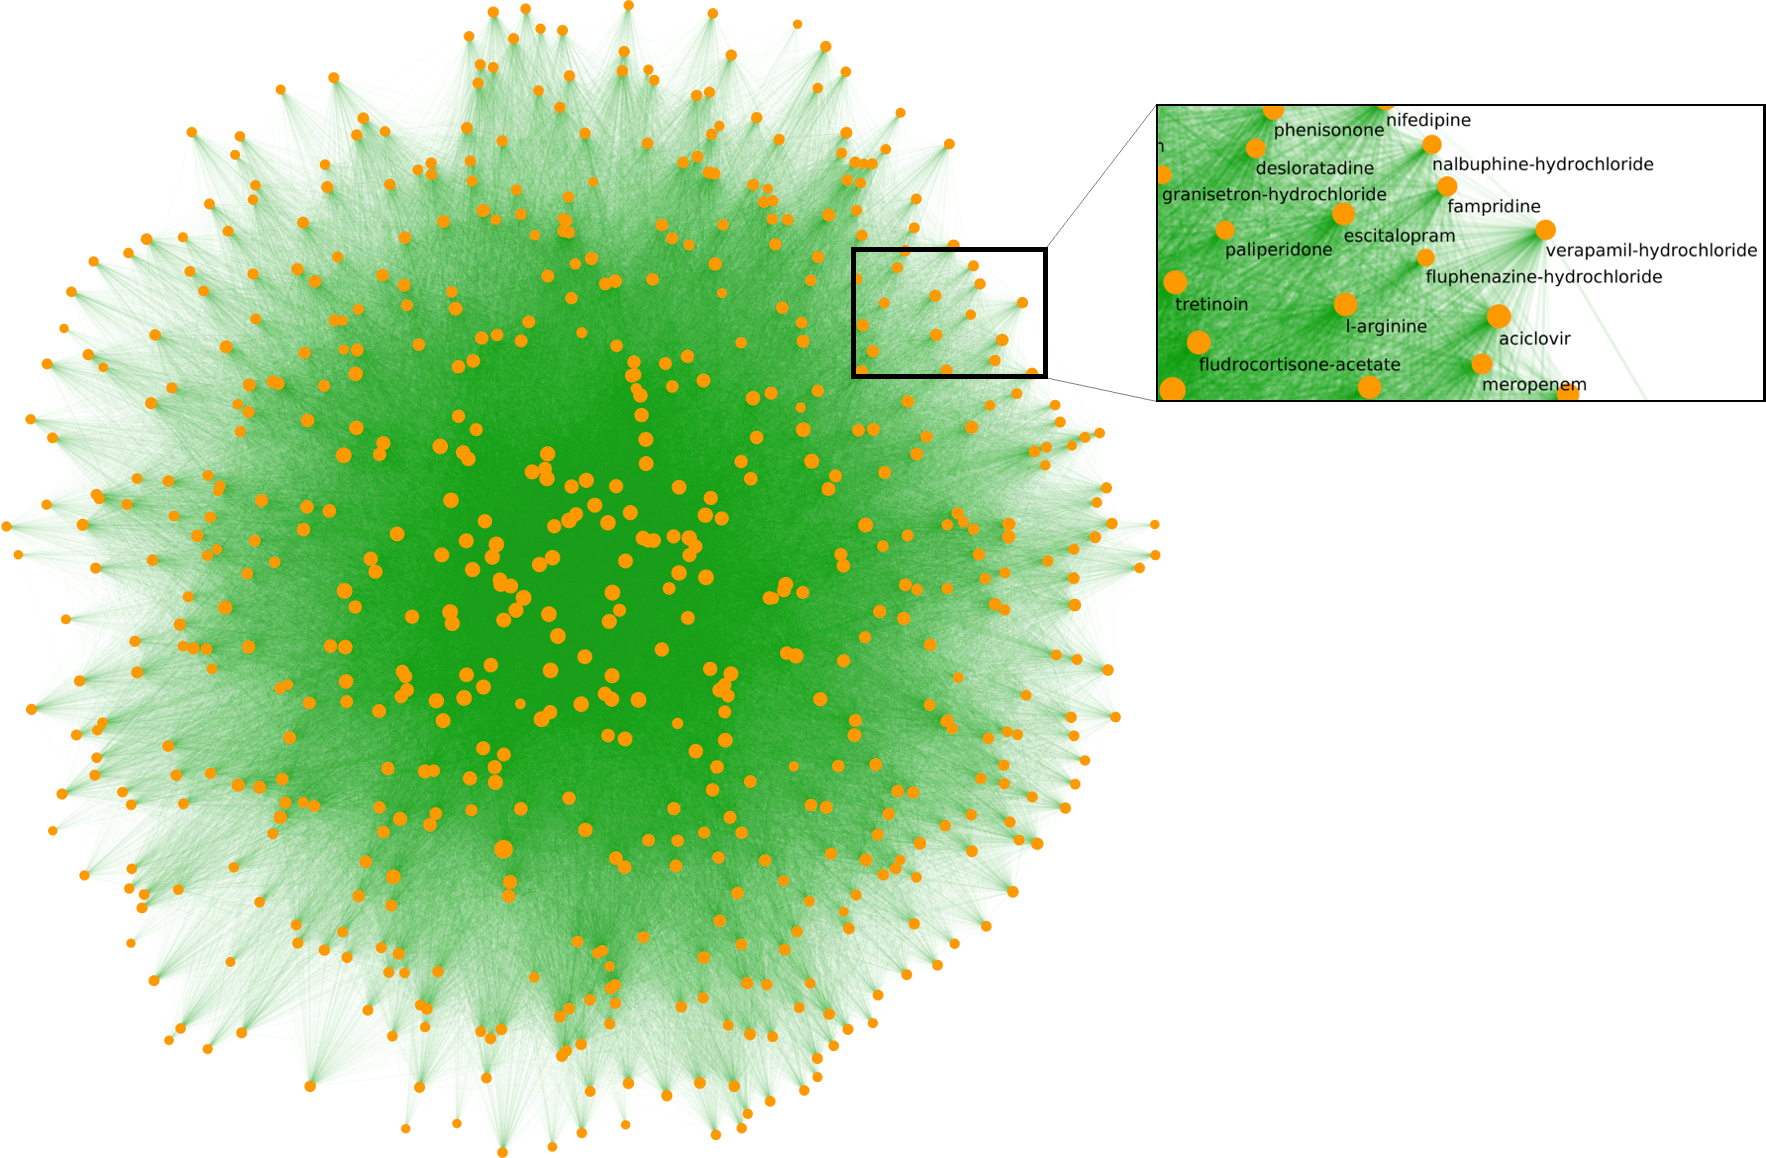
Predicting proposed indications of compounds currently in clinical trials
While the previous section demonstrated our approach can effectively recover known indications, predictions after the fact are—while useful—best supported by more forward-looking evidence. In this section, we use clinical trial data to support our predictions where the ultimate success of our target drug is still unknown. Using Cortellis Clinical Trials Intelligence, we extracted drugs present in our Twitter data set that were currently undergoing clinical trials (ending after 2014) for a novel indication (i.e., for which they were not already indicated), resulting in a subset of 277 drugs currently in trials for 397 indications. Figure 3 shows the percentage at which a co-indicated drug was ranked amongst the top 5, 10, 15, 20 and 25 predictions for the target. Similar to the recovery of known indications, best performance when considering the top 5 ranked predictions was achieved with a λ value of 10−9, resulting in 16.25% (45/277) of targets having a co-indicated drug, which again compares well to a randomized strategy (5.42%, standard error ± 0.32) or a strategy using the Jaccard index (10.07%).
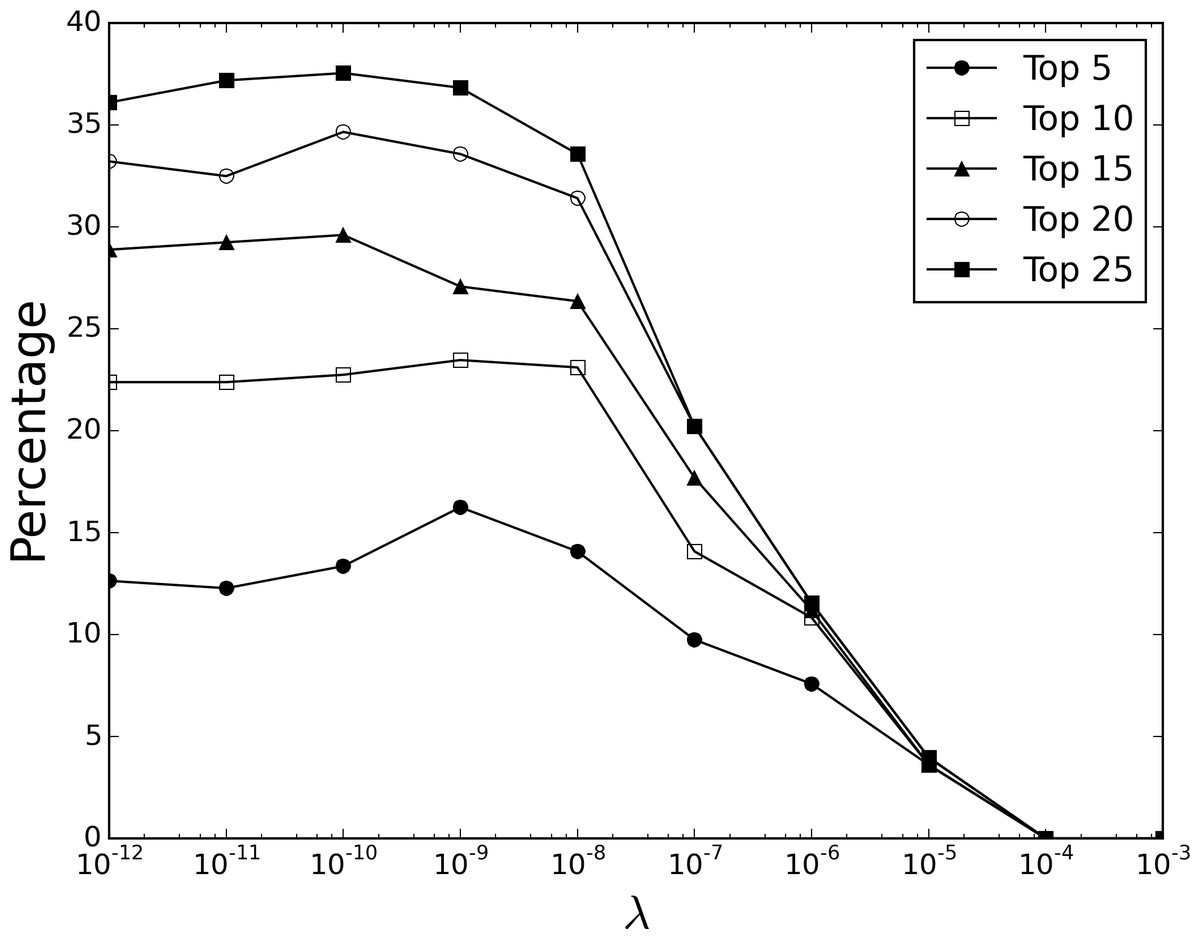
Figure 3: Recovery of proposed clinical trial indications.
Percentage at which a co-indicated drug is returned amongst the top 5, 10, 15, 20 and 25 ranked predictions for a given target, at different λ values.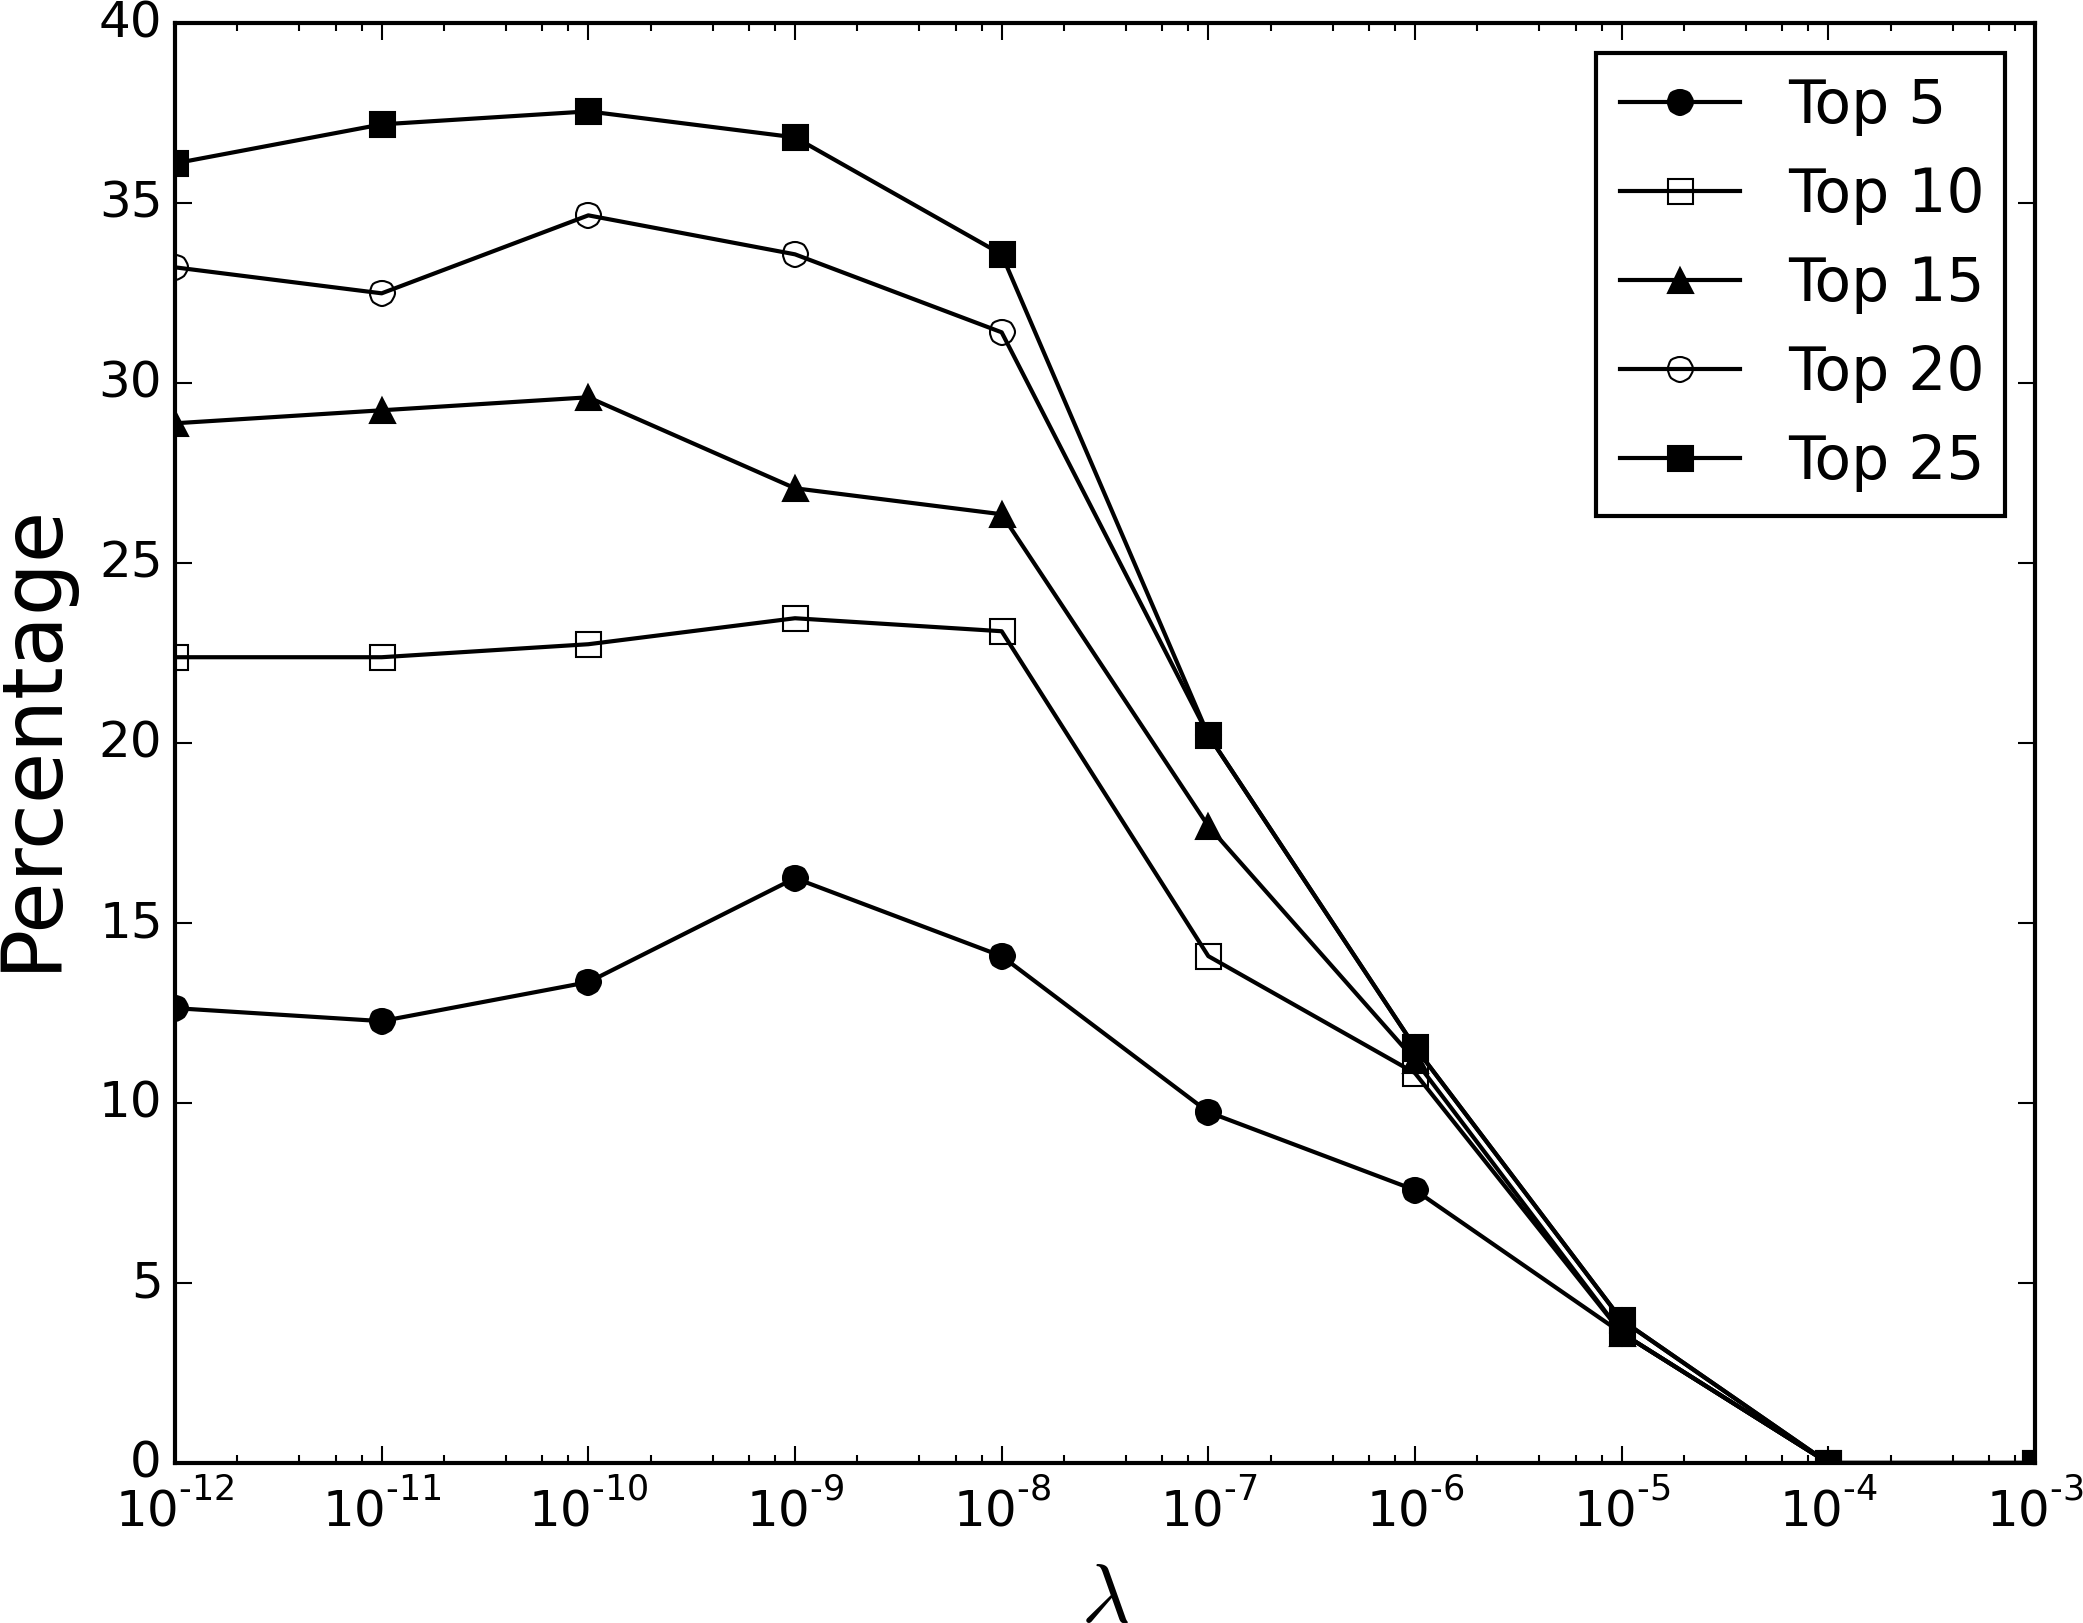
Recovery of proposed clinical trial indications is clearly more challenging than known indications, possibly reflecting the fact that a large proportion of drugs will fail during trials and therfore many of the 397 proposed indications analysed here will in time prove false, although the general trend in performance as the sparsity parameter λ is adjusted tends to mirror the recovery of known indications. Despite this, a number of interesting predictions with a diverse range of novel indications are made that are supported by experimental and clinical evidence; a selection of 10 of the 45 drugs where the trial indication was correctly predicted are presented in Table 1. We further investigated three repositioning candidates with interesting pharmacology to understand their predicted results.
| Drug | Current indication | New indication | Evidence | PCC | Rank | ID | Title |
|---|---|---|---|---|---|---|---|
| Ramelteon | Insomnia | Bipolar I disorder | Ziprasidone | 0.197 | 2 | 6991 | Ramelteon for the treatment of insomnia and mood stability in patients with euthymic bipolar disorder |
| Denosumab | Osteoporosis | Breast cancer | Capecitabine | 0.133 | 3 | 85503 | Pilot study to evaluate the impact of denosumab on disseminated tumor cells (DTC) in patients with early stage breast cancer |
| Meloxicam | Inflammation | Non-Hodgkin lymphoma | Rituximab | 0.131 | 1 | 176379 | A phase II trial using meloxicam plus filgrastim in patients with multiple myeloma and non-Hodgkins lymphoma |
| Sulfasalazine | Rheumatoid arthritis | Diarrhea | Loperamide | 0.106 | 5 | 155516 | Sulfasalazine in preventing acute diarrhea in patients with cancer who are undergoing pelvic radiation therapy |
| Pyridostigmine | Myasthenia gravis | Cardiac failure | Digitoxin | 0.100 | 4 | 190789 | Safety study of pyridostigmine in heart failure |
| Alprazolam | Anxiety disorder | Epilepsy | Clonazepam | 0.097 | 4 | 220920 | Staccato alprazolam and EEG photoparoxysmal response |
| Oxytocin | Prader-Willi syndrome | Schizophrenia | Chlorpromazine | 0.096 | 3 | 163871 | Antipsychotic effects of oxytocin |
| Interferon alfa | Leukemia | Thrombocythemia | Hydroxyurea | 0.094 | 3 | 73064 | Pegylated interferon Alfa-2a salvage therapy in high-risk polycythemia vera (PV) or essential thrombocythemia (ET) |
| Etomidate | General anesthesia | Depression | Trazodone | 0.091 | 5 | 157982 | Comparison of effects of propofol and etomidate on rate pressure product and oxygen saturation in patients undergoing electroconvulsive therapy |
| Guaifenesin | Respiratory tract infections | Rhinitis | Ipratropium | 0.090 | 5 | 110111 | The effect of oral Guaifenesin on pediatric chronic rhinitis: a pilot study |
Oxytocin
Oxytocin is a nonapeptide hormone that acts primarily as a neuromodulator in the brain via the specific, high-affinity oxytocin receptor—a class I (Rhodopsin-like) G-protein-coupled receptor (GPCR) (Gimpl et al., 2002). Currently, oxytocin is used for labor induction and the treatment of Prader-Willi syndrome, but there is compelling pre-clinical evidence to suggest that it may play a crucial role in the regulation of brain-mediated processes that are highly relevant to many neuropsychiatric disorders (Feifel, 2012). A number of animal studies have revealed that oxytocin has a positive effect as an antipsychotic (Feifel & Reza, 1999; Lee et al., 2005), while human trials have revealed that intranasal oxytocin administered to highly symptomatic schizophrenia patients as an adjunct to their antipsychotic drugs improves positive and negative symptoms significantly more than placebo (Feifel et al., 2010; Pedersen et al., 2011). These therapeutic findings are supported by growing evidence of oxytocin’s role in the manifestation of schizophrenia symptoms such as a recent study linking higher plasma oxytocin levels with increased pro-social behavior in schizophrenia patients and with less severe psychopathology in female patients (Rubin et al., 2010). The mechanisms underlying oxytocin’s therapeutic effects on schizophrenia symptoms are poorly understood, but its ability to regulate mesolimbic dopamine pathways are thought to be responsible (Feifel, 2012). Here, our method predicts schizophrenia as a novel indication for oxytocin based on its proximity to chlorpromazine, which is currently used to treat schizophrenia (Fig. 4). Chlorpromazine also modulates the dopamine pathway by acting as an antagonist of the dopamine receptor, another class I GPCR. Interestingly, the subgraph indicates that dopamine also has a high partial correlation coefficient with oxytocin, adding further support to the hypothesis that oxytocin, chlorpromazine and dopamine all act on the same pathway and therefore have similar side-effect profiles. Side-effects shared by oxytocin and chlorpromazine include hallucinations, excessive salivation and anxiety, while shivering, weight gain, abdominal pain, nausea, and constipation are common side-effects also shared by other drugs within the subgraph. Currently, larger scale clinical trials of intranasal oxytocin in schizophrenia are underway. If the early positive results hold up, it may signal the beginning of an new era in the treatment of schizophrenia, a field which has seen little progress in the development of novel efficacious treatments over recent years.
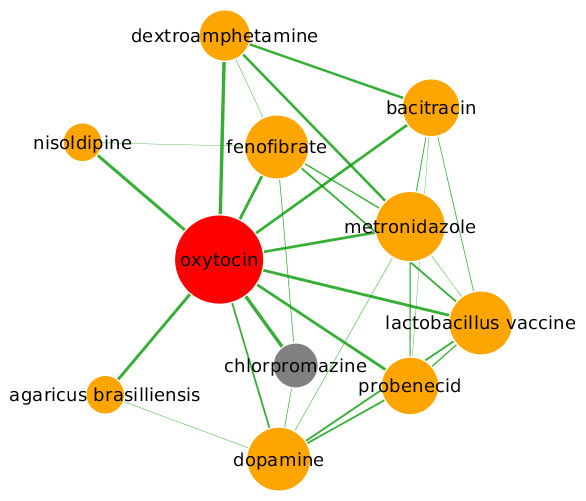
Figure 4: Predicted repositioning of oxytocin (red) for the treatment of schizophrenia based on its proximity to the schizophrenia drug chlorpromazine (grey).
Drugs in the graph are sized according to their degree (number of edges), while the thickness of a connecting edge is proportional to the partial correlation coefficient between the two drugs. The graph layout is performed by Cytoscape (Lopes et al., 2010) which applies a force-directed approach based on the partial correlation coefficient. Nodes are arranged so that edges are of more or less equal length and there are as few edge crossings as possible. For clarity, only the top ten drugs ranked by partial correlation coefficient are shown.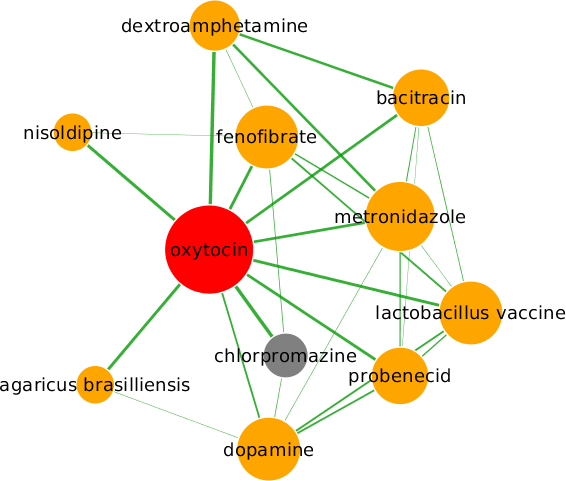
Ramelteon
Ramelteon, currently indicated for the treatment of insomnia, is predicted to be useful for the treatment of bipolar depression (Fig. 5). Ramelteon is the first in a new class of sleep agents that selectively binds the MT1 and MT2 melatonin receptors in the suprachiasmatic nucleus, with high affinity over the MT3 receptor (Owen, 2006). It is believed that the activity of ramelteon at MT1 and MT2 receptors contributes to its sleep-promoting properties, since these receptors are thought to play a crucial role in the maintenance of the circadian rhythm underlying the normal sleep-wake cycle upon binding of endogenous melatonin. Abnormalities in circadian rhythms are prominent features of bipolar I disorder, with evidence suggesting that disrupted sleep-wake circadian rhythms are associated with an increased risk of relapse in bipolar disorder (Jung et al., 2014). As bipolar patients tend to exhibit shorter and more variable circadian activity, it has been proposed that normalisation of the circadian rhythm pattern may improve sleep and consequently lead to a reduction in mood exacerbations. Melatonin receptor agonists such as ramelteon may have a potential therapeutic effect in depression due to their ability to resynchronize the suprachiasmatic nucleus (Wu et al., 2013). In Fig. 5, evidence supporting the repositioning of ramelteon comes from ziprasidone, an atypical antipsychotic used to treat bipolar I disorder and schizophrenia (Nicolson & Nemeroff, 2007). Ziprasidone is the second-ranked drug by partial correlation coefficient; a number of other drugs used to treat mood disorders can also be located in the immediate vicinity including phenelzine, a non-selective and irreversible monoamine oxidase inhibitor (MAOI) used as an antidepressant and anxiolytic, milnacipran, a serotonin–norepinephrine reuptake inhibitor used to treat major depressive disorder, and tranylcypromine, another MAOI used as an antidepressant and anxiolytic agent. The co-location of these drugs in the same region of the graph suggests a degree of overlap in their respective mechanistic pathways, resulting in a high degree of similarity between their side-effect profiles. Nodes in this subgraph also have a relatively large degree indicating a tighter association than for other predictions, with common shared side-effects including dry mouth, sexual dysfunction, migraine, and orthostatic hypotension, while weight gain is shared between ramelteon and ziprasidone.
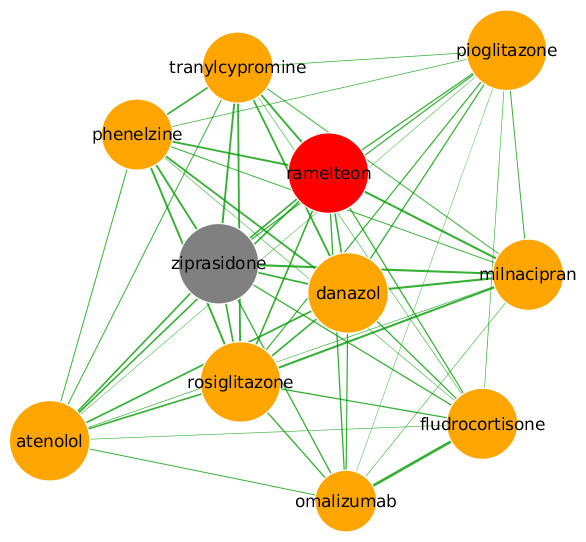
Figure 5: Predicted repositioning of ramelteon (red) for the treatment of bipolar I disorder based on its proximity to ziprasidone (grey).
Along with ziprasidone, phenelzine, milnacipran and tranylcypromine are all used to treat mood disorders.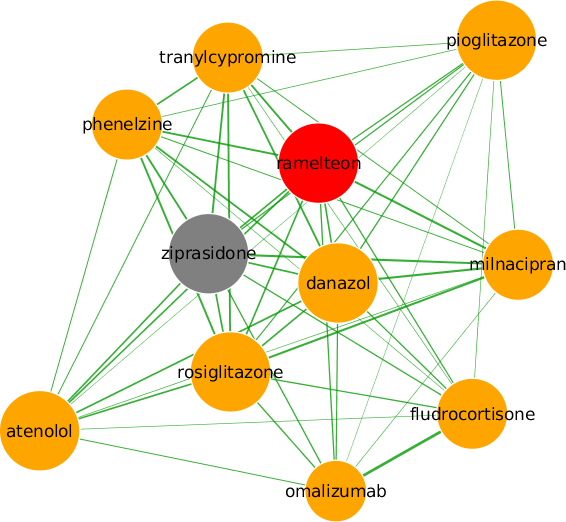
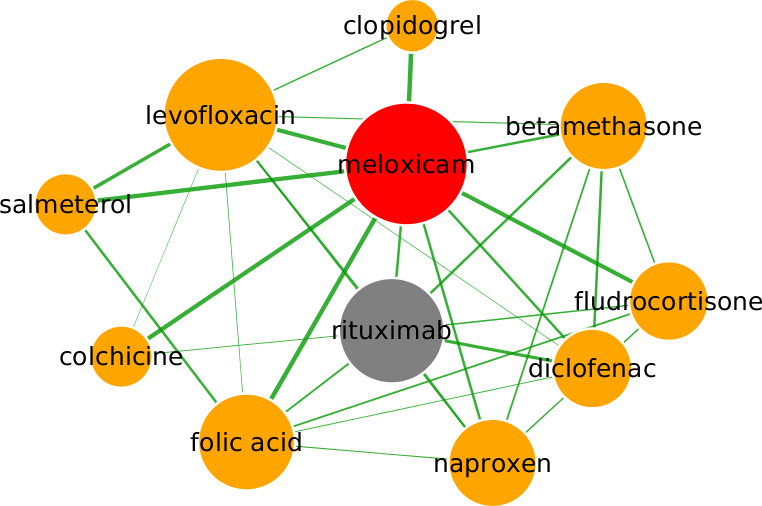
Meloxicam
Meloxicam, a nonsteroidal anti-inflammatory drug (NSAID) used to treat arthritis, is predicted to be a repositioning candidate for the treatment of non-Hodgkin lymphoma, via the mobilisation of autologous peripheral blood stem cells from bone marrow. By inhibiting cyclooxygenase 2, meloxicam is understood to inhibit generation of prostaglandin E2, which is known to stimulate osteoblasts to release osteopontin, a protein which encourages bone resorption by osteoclasts (Rainsford, Ying & Smith, 1997; Ogino et al., 2000). By inhibiting prostaglandin E2 and disrupting the production of osteopontin, meloxicam may encourage the departure of stem cells, which otherwise would be anchored to the bone marrow by osteopontin (Reinholt et al., 1990). In Fig. 6, rituximab, a B-cell depleting monoclonal antibody that is currently indicated for treatment of non-Hodgkin lymphoma, is the top ranked drug by partial correlation, which provides evidence for repositioning to this indication. Interestingly, depletion of B-cells by rituximab has recently been demonstrated to result in decreased bone resorption in patients with rheumatoid arthritis, possibly via a direct effect on both osteoblasts and osteoclasts (Wheater et al., 2011; Boumans et al., 2012), suggesting a common mechanism of action between meloxicam and rituximab. Further evidence is provided by the fifth-ranked drug clopidogrel, an antiplatelet agent used to inhibit blood clots in coronary artery disease, peripheral vascular disease, cerebrovascular disease, and to prevent myocardial infarction. Clopidogrel works by irreversibly inhibiting the adenosine diphosphate receptor P2Y12, which is known to increase osteoclast activity (BonekEY Watch, 2012). Similarly to the ramelteon subgraph, many drugs in the vicinity of meloxicam are used to treat inflammation including diclofenac, naproxen (both NSAIDs) and betamethasone, resulting in close association between these drugs, with shared side-effects in the subgraph including pain, cramping, flushing and fever, while swelling, indigestion, inflammation and skin rash are shared by meloxicam and rituximab.
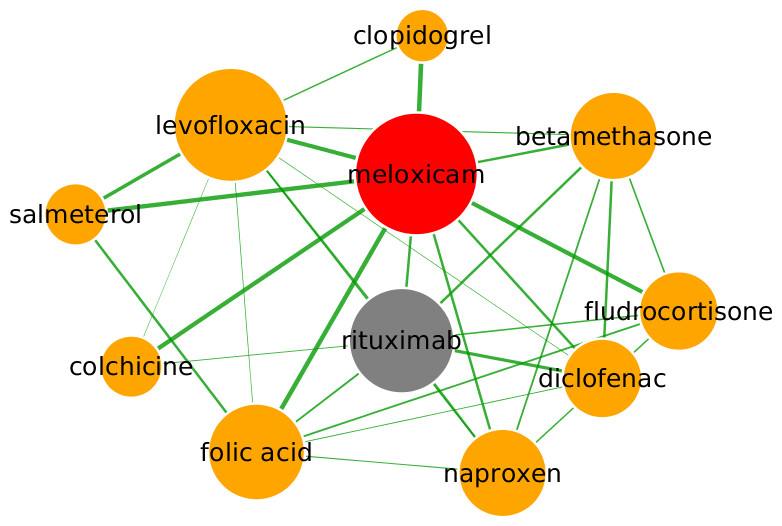
Figure 6: Predicted repositioning of meloxicam (red) for the treatment of non-Hodgkin lymphoma based on its proximity to rituximab (grey).
While the side-effects shared within the subgraphs of our three examples are commonly associated with a large number of drugs, some of the side-effects shared by the three drug pairs such as hallucinations, excessive salivation and anxiety are somewhat less common. To investigate this relationship for the data set as a whole, we calculated log frequencies for all side-effects and compared these values against the normalized average rank of pairs where the side-effect was shared by both the query and target drug. If we assume that a higher ranking in our model indicates a higher likelihood of drugs sharing a protein target, this relationship demonstrates similar properties to the observations of Campillos et al. (2008) in that there is a negative correlation between the rank and frequency of a side-effect. The correlation coefficient has a value of −0.045 which is significantly different from zero at the 0.001 level, although the linear relationship appears to break down where the frequency of the side-effect is lower than about 0.025.
Conclusions
In this study, we have used side-effect data mined from social media to generate a sparse graphical model, with nodes in the resulting graph representing drugs, and edges between them representing the similarity of their side-effect profiles. We demonstrated that known indications can be inferred based on the indications of neighbouring drugs in the network, with 42.41% of targets having their known indication identified amongst the top 5 ranked predictions, while 16.25% of drugs that are currently in a clinical trial have their proposed trial indication correctly identified. These results indicate that the volume and diversity of drug side-effects reported using social media is sufficient to be of use in side-effect-based drug repositioning, and this influence is likely to increase as the audience of platforms such as Twitter continues to see rapid growth. It may also help to address the problem of side-effect under-reporting. We also demonstrate that global statistical models such as the graphical lasso are well-suited to the analysis of large multivariate systems such as drug–drug networks. They offer significant advantages over conventional pairwise similarity methods by incorporating indirect relationships between all variables, while the use of the lasso penalty allows a sparse, parsimonious model to be generated with fewer spurious connections resulting in a simpler theory of relationships.
While our method shows encouraging results, it is more likely to play a role in drug repositioning as a component in an integrated approach. Whether this is achieved by combining reported side-effects with those mined from resources such as SIDER, or by using predictions as the inputs to a supervised learning algorithm, a consensus approach is likely to achieve higher performance by incorporating a range of different data sources in addition to drug side-effects, while also compensating for the weaknesses of any single method (Emig et al., 2013). Limitations of our method largely stem from the underlying Twitter data (Plachouras, Leidner & Garrow, under review). Only a small fraction of daily tweets contain reports of drug side-effects, therefore restricting the number of drugs we are able to analyse. However, given that systems such as SoMeDoSEs are capable of continuously monitoring Twitter, the numbers of drugs and reported side-effects should steadily accumulate over time.
To address this, in the future it may be possible to extend monitoring of social media to include additional platforms. For example, Weibo is a Chinese microblogging site akin to Twitter, with over 600 million users as of 2013. Clearly, tools will have to be adapted to deal with multilingual data processing or translation issues, while differences in cultural attitudes to sharing medical information may present further challenges. Extensions to the statistical approach may also result in improved performance. Methods such as the joint graphical lasso allow the generation of a graphical model using data with observations belonging to distinct classes (Danaher, Wang & Witten, 2014). For example, two covariances matrices generated using data from Twitter and SIDER could be combined in this way, resulting in a single model that best represents both sources. An extension to the graphical lasso also allows the decomposition of the sample covariance graph into smaller connected components via a thresholding approach (Mazumder & Hastie, 2012). This leads not only to large performance gains, but significantly increases the scalability of the graphical lasso approach.
Another caveat to consider, common to many other repositioning strategies based on side-effect similarity, is that there is no evidence to suggest whether a repositioning candidate will be a better therapeutic than the drug from which the novel indication was inferred. While side-effects can provide useful information for inferring novel indications, they are in general undesirable and need to be balanced against any therapeutic benefits. Our model does not attempt to quantify efficacy or side-effect severity, but it might be possible to modify the natural language processing step during Twitter mining in order to capture comparative mentions of side-effects, since tweets discussing both the therapeutic and side-effects of two related drugs are not uncommon. Incorporating this information into our model may allow a more quantitative assessment of the trade-off between therapeutic and side-effects to be made as part of the prediction.