
This article was written by Natasha Latysheva. Here we publish a short version, with references to full source code in the original article.
Our internal data scientist had a few questions and comments about the article:
- The example used to illustrate the method in the source code is the famous iris data set, consisting of 3 clusters, 150 observations, and 4 variables, first analysed in 1936. How does the methodology perform on large data sets with many variables, or on unstructured data?
- Why was Python chosen to do this analysis? I think this is great, but I would be interested to know the motivation.
- The author mentioned other clustering techniques, such as SVM, Naive Bayes (issued from statistical science) or neural networks. Given the fact that her article is published in data science outlets, why is there no reference to extremely efficient indexation methods or automated tagging algorithms (no matter what the programming language implementation), used to cluster billions of web pages or to create large product taxonomies or catalogs, with an O(n) computational complexity: this is a core data science clustering technique developed by data scientists. Fast KNN techniques also exist (and we will publish one shortly with potential Map-Reduce implementation), but it is hard to beat O(n) for this problem, where n is the number of observations.
- For those interested in KNN related technology, here’s an interesting paper that I wrote a while back.
For other articles about KNN, click here.
Here’s the article (short version)
In machine learning, you may often wish to build predictors that allows to classify things into categories based on some set of associated values. For example, it is possible to provide a diagnosis to a patient based on data from previous patients.
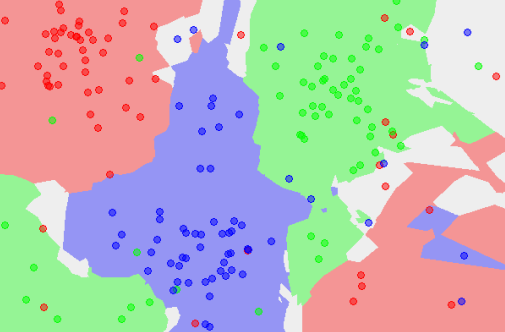
Classification can involve constructing highly non-linear boundaries between classes, as in the case of the red, green and blue classes below:
Many algorithms have been developed for automated classification, and common ones include random forests, support vector machines, Naïve Bayes classifiers, and many types of neural networks. To get a feel for how classification works, we take a simple example of a classification algorithm – k-Nearest Neighbours (kNN) – and build it from scratch in Python 2. You can use a mostly imperative style of coding, rather than a declarative/functional one with lambda functions and list comprehensions to keep things simple if you are starting with Python. Here, we will provide an introduction to the latter approach.
kNN classifies new instances by grouping them together with the most similar cases. Here, you will use kNN on the popular (if idealized) iris dataset, which consists of flower measurements for three species of iris flower. Our task is to predict the species labels of a set of flowers based on their flower measurements. Since you’ll be building a predictor based on a set of known correct classifications, kNN is a type of supervised machine learning (though somewhat confusingly, in kNN there is no explicit training phase; see lazy learning).
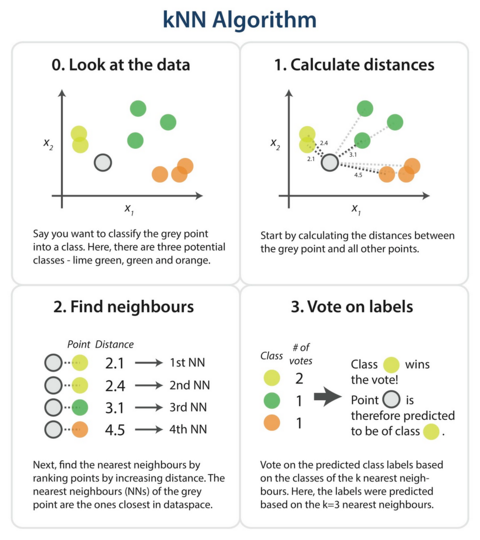
The kNN task can be broken down into writing 3 primary functions:
- Calculate the distance between any two points
- Find the nearest neighbours based on these pairwise distances
- Majority vote on a class labels based on the nearest neighbour list
The steps in the following diagram provide a high-level overview of the tasks you’ll need to accomplish in your code.
The algorithm
Briefly, you would like to build a script that, for each input that needs classification, searches through the entire training set for the k-most similar instances. The class labels of the most similar instances should then be summarized by majority voting and returned as predictions for the test cases.
The complete code is at the end of the post. Now, let’s go through the different parts separately and explain what they do.
The following sections as well as the source code are available in the original (quite long) article.
- Loading the data and splitting into train and test sets (cross-validation)
- Measuring distance between all cases
- Getting the neighbours to vote on the class of the test points
- Running our algorithm
- Refinements
About the author (of the original article)
Natasha is a computational biology PhD student at the MRC Laboratory of Molecular Biology. Her research is focused on cancer genomics, statistical network analysis, and protein structure. More generally, her research interests lie in data-intensive molecular biology, machine learning (especially deep learning) and data science.
DSC Resources
- Career: Training | Books | Cheat Sheet | Apprenticeship | Certification | Salary Surveys | Jobs
- Knowledge: Research | Competitions | Webinars | Our Book | Members Only | Search DSC
- Buzz: Business News | Announcements | Events | RSS Feeds
- Misc: Top Links | Code Snippets | External Resources | Best Blogs | Subscribe | For Bloggers
Additional Reading
- What statisticians think about data scientists
- Data Science Compared to 16 Analytic Disciplines
- 10 types of data scientists
- 91 job interview questions for data scientists
- 50 Questions to Test True Data Science Knowledge
- 24 Uses of Statistical Modeling
- 21 data science systems used by Amazon to operate its business
- Top 20 Big Data Experts to Follow (Includes Scoring Algorithm)
- 5 Data Science Leaders Share their Predictions for 2016 and Beyond
- 50 Articles about Hadoop and Related Topics
- 10 Modern Statistical Concepts Discovered by Data Scientists
- Top data science keywords on DSC
- 4 easy steps to becoming a data scientist
- 22 tips for better data science
- How to detect spurious correlations, and how to find the real ones
- 17 short tutorials all data scientists should read (and practice)
- High versus low-level data science
Follow us on Twitter: @DataScienceCtrl | @AnalyticBridge