
The identification of immune genes in the milk transcriptome of the Tasmanian devil (Sarcophilus harrisii)
- Published
- Accepted
- Received
- Academic Editor
- David Coltman
- Subject Areas
- Conservation Biology, Zoology
- Keywords
- Tasmanian devil, Milk, Lactation, Devil facial tumour disease, Marsupial, Immunity
- Copyright
- © 2016 Hewavisenti et al.
- Licence
- This is an open access article distributed under the terms of the Creative Commons Attribution License, which permits unrestricted use, distribution, reproduction and adaptation in any medium and for any purpose provided that it is properly attributed. For attribution, the original author(s), title, publication source (PeerJ) and either DOI or URL of the article must be cited.
- Cite this article
- 2016. The identification of immune genes in the milk transcriptome of the Tasmanian devil (Sarcophilus harrisii) PeerJ 4:e1569 https://doi.org/10.7717/peerj.1569
Abstract
Tasmanian devil (Sarcophilus harrisii) pouch young, like other marsupials, are born underdeveloped and immunologically naïve, and are unable to mount an adaptive immune response. The mother’s milk provides nutrients for growth and development as well as providing passive immunity. To better understand immune response in this endangered species, we set out to characterise the genes involved in passive immunity by sequencing and annotating the transcriptome of a devil milk sample collected during mid-lactation. At mid-lactation we expect the young to have heightened immune responses, as they have emerged from the pouch, encountering new pathogens. A total of 233,660 transcripts were identified, including approximately 17,827 unique protein-coding genes and 846 immune genes. The most highly expressed transcripts were dominated by milk protein genes such as those encoding early lactation protein, late lactation proteins, α-lactalbumin, α-casein and β-casein. There were numerous highly expressed immune genes including lysozyme, whey acidic protein, ferritin and major histocompatibility complex I and II. Genes encoding immunoglobulins, antimicrobial peptides, chemokines and immune cell receptors were also identified. The array of immune genes identified in this study reflects the importance of the milk in providing immune protection to Tasmanian devil young and provides the first insight into Tasmanian devil milk.
Introduction
The Tasmanian devil (Sarcophilus harrisii) is the largest carnivorous marsupial in the world and belongs to the Dasyuridae family (McCallum, 2008). It is endangered due to the spread of Devil Facial Tumour Disease (DFTD) (Hawkins et al., 2009). Devils, like all other marsupial species, have a short gestation followed by an extended lactation period. Marsupial young are born at an early stage in development and do not have a functional adaptive immune system (Basden, Cooper & Deane, 1997; Old & Deane, 2000; Old & Deane, 2003). Immune compounds in the milk provide critical immune protection (Adamski & Demmer, 2000; Daly et al., 2007). Devils give birth to large litters of 20–30, after a gestation of approximately 24 days (Hesterman, Jones & Schwarzenberger, 2008), with a maximum of four pouch young (PY) attaching to the four teats in the pouch for further development. PY are permanently attached to the teat until 100 days, when they start to intermittently suckle. Beginning at approximately 105 days, the PY are left in the den while the mother scavenges for food. Lactation ceases approximately seven to eight months post parturition (Guiler, 1970).
The endangered status of the Tasmanian devils necessitates urgent research into the immune response of the species. It is notable that despite an apparent susceptibility to cancer (Canfield, Hartley & Reddacliff, 1990; Griner, 1979), a current transmissible cancer epidemic (Jones et al., 2004), and a paucity of genetic diversity due to several population bottlenecks (Brueniche-Olsen et al., 2014; Jones et al., 2004; Morris, Austin & Belov, 2013), the species is remarkably resilient to disease. Devils are scavengers and are able to digest entire rotting carcasses (Owen & Pemberton, 2005) and carry large parasite loads without showing any deleterious effects (Beveridge et al., 1975; Beveridge & Spratt, 2003). Over the past seven years we have begun to characterise the immunogenome of the devil, including characterisation of major histocompatibility complex (MHC) (Cheng et al., 2012; Siddle, Sanderson & Belov, 2007), Natural Killer (NK) cell receptors (Van Der Kraan et al., 2013), Toll-like receptors (Cui, Cheng & Belov, 2015), cytokines and immunoglobulins (Morris et al., 2015). A gap remaining in our understanding of devil immunity is the role of passive immunity in protecting the devil young while they are in the pouch. Here, we identify key milk proteins, with a focus on key immune genes, in the milk transcriptome of the Tasmanian devil, at four months of lactation. At this time, the mother is in late mid-lactation and the devil young are beginning to be left in the den, while the mother scavenges for food. During this time, PY are exposed to a range of novel pathogens within the den and in the solid food they are beginning to eat. In other marsupials it has been demonstrated that late in mid-lactation, immune compounds are upregulated to provide young with additional immune protection as they encounter novel pathogens (Adamski & Demmer, 2000; Daly et al., 2007), thus we expect the devil milk at this time to be enriched with immune compounds.
Previous studies into milk protein composition in marsupials have mostly examined single proteins or small groups of proteins (Adamski & Demmer, 2000; Daly et al., 2007; Joss et al., 2007). A single study in the tammar wallaby (Macropus eugenii) has looked at the protein composition of milk on a wider scale through transcriptomics (Lefevre et al., 2007). This study identified key immune genes including cathelicidins, IgA, major histocompatibility complex class II (MHC II), Igκ light chain and butyrophilin in wallaby milk. Here we describe the immune gene composition of Tasmanian devil milk at mid-lactation and comment on the relevance of these findings to Tasmanian devil biology and immunity.
Materials & Methods
Ethics statement
The milk collection in this study was approved by The University of Sydney Animal Ethics Committee (Animal Ethics no. 6039).
Sampling
Approximately 10 mL of milk was collected from a Tasmanian devil at approximately four months (∾120 days) post-parturition. The animal was held at the Australian Reptile Park, Somersby, NSW, Australia.
RNA isolation and sequencing
The milk sample was kept on ice during transport and RNA extraction was carried out within 2–3 h after collection. Approximately 7 ml of milk was centrifuged at 2,000 × g at 4 °C for 10 min. The top fat layer was removed and the bottom layer was washed once using 10 ml PBS (pH 7.2, with 0.5 mM EDTA) followed by centrifugation at 2,000 × g and 4 °C for 10 min. The cell pellet (which would have contained neutrophils, macrophages and lymphocytes, with a lower abundance of epithelial cells and granulocytes (Young et al., 1997; Young & Deane, 2001) was recovered and RNA was extracted using 1 ml TRIzol® Reagent (Life Technologies, Carlsbad, CA, USA), following the RNA extraction protocol of the manufacturer, including removal of fat, proteins and other material, and an RNase-Free DNase Set (Qiagen, Hilden, Germany) was used to remove DNA contamination from the extracted RNA. A second round of purification was performed using an RNeasy Mini Kit (Qiagen, Hilden, Germany) and quality-checked on a Bioanalyser (Agilent Technologies, Santa Clara, CA USA). The final yield of total RNA was approximately 320 ng and RNA integrity number was 7.3. Library construction and sequencing were performed by The Ramaciotti Centre (UNSW) with TruSeq chemistry on a HiSeq2000 (Illumina, San Diego, CA, USA). Approximately 22.5 million paired 100 bp reads were obtained, totalling over 44.9 Gbp of data. Reads were submitted to the NCBI Sequence Read Archive under the BioProject accession PRJNA274196and BioSample accession SUB812082. The assembled transcriptome was submitted to the Transcriptome Shotgun Assembly Sequence Database under accession GEDN00000000.
Transcriptome assembly and annotation
RNAseq reads were assembled with the Trinity pipeline (released 10 November 2013) (Haas et al., 2013) using the default parameters. This assembly resulted in 200,829 contigs, with an N50 contig size of 2,720 bp, a mean contig length of 1,285 bp, and a transcript sum of 258.1 Mb. Functional annotation of the devil milk transcriptome was performed using the Trinotate pipeline (released 10 November 2013 (default settings): http://trinotate.github.io). In brief, BLASTp was performed using devil milk predicted ORFs as the query and the SwissProt non-redundant database (accessed 29th July 2013) as the target and the de novo transcripts aligned against the same using BLASTx (Altschul et al., 1990). HMMER v3.1b1 and Pfam v27 databases (Finn, Clements & Eddy, 2011) were used to predict protein domains, SignalP v4.1 (Petersen et al., 2011) to predict the presence of signal peptides, RNAmmer v1.2 (Lagesen et al., 2007) to predict rDNA, and TMHMM v2.0 (Krogh et al., 2001) to predict transmembrane helices within the predicted ORFs from the milk transcriptome. These transcriptome annotations were loaded into an SQLite database, and abundance estimation was performed using the RSEM v1.2.1 (default settings) (Li & Dewey, 2011) method. GO terms linked to the SwissProt entry of the best BLAST hit were used for ontology annotation. GO functional classifications and plotting was performed by WEGO (http://wego.genomics.org.cn) (Jia et al., 2006).
Top 200 most highly expressed transcripts
The most highly expressed transcript variants were selected based on FPKM (fragments per kilobase of exon per million fragments mapped) gene expression estimation. Twenty-four transcripts of the top 200 had no BLAST hits through the Trinotate pipeline. In order to annotate these transcripts, they were further investigated using BLAST searches against the Tasmanian devil genome on ENSEMBL (release 75) (http://www.ensembl.org/index.html), or tBLASTx to GenBank nucleotide and EST collections. Transcripts that had poor BLAST hits (E-value >1 × 10⁻¹⁰) to SwissProt sequences were also verified using these methods.
For sequences that could not be identified using the above methods, HMMER v3.1b1 (Finn, Clements & Eddy, 2011) and SignalP v4.1 (Petersen et al., 2011) searches were used. Rfam 12.0 (Griffiths-Jones et al., 2003) and Pfam v27 (Finn et al., 2014) were used to identify conserved RNA and protein domains respectively. Finally, genes were identified with the aid of conserved flanking genes in the tammar wallaby and gray short-tailed opossum (Monodelphis domestica) genomes. Genes flanking the unidentified genes were identified in the devil genome. Syntenic regions in the opossum and wallaby genomes were then searched for genes with homology to the devil sequence using FGENESH+ (Solovyey, 2007). Using this process, the top 200 highly expressed transcripts from the milk transcriptome were identified and annotated.
Phylogenetic analysis
To investigate the evolutionary relationship between the late lactation proteins (LLP) of the devil and the various marsupial species, LLP protein sequences from the tammar wallaby (LLP-A (Genbank: AAQ15117), LLP-B (Genbank: AAL85634)), gray short-tailed opossum (Monodelphis domestica) (LLP-B1 (Genbank: XP˙007475421), LLPB-B2 (Ensemble: ENSMODG00000017471), LLP-B3 (Ensemble: ENSMODG00000017468), LLP-B4 (Ensemble: ENSMODG00000025759)), quokka (Setonix brachyurus) (Genbank: AAB33234.1) and brushtail possum (Trichosurus vulpecula) (Genbank: AAA93179.1) were obtained for phylogenetic tree construction. Tasmanian devil protein sequences for LLP-A, LLP-B, and a homolog (named LLP-like), predicted from the devil transcripts, were used in the phylogenetic tree construction for evolutionary analysis. As the transcript for LLP-like was only partial, to obtain the full sequence the missing exons were predicted from the devil genome. The region encoding LLP-like was identified using BLAST to the devil genome. This region and devil LLP-B were used as inputs in FGENESH+ (Solovyey, 2007), to identify the missing exons for the prediction. As LLP proteins belong to the lipocalin family, the opossum lipocalin-1 (Genbank: XP˙007475462.1) was used as an outgroup. MEGA 6 (Tamura et al., 2013) was used to analyse the phylogenetic evolutionary relationships between the marsupial LLP sequences. Protein sequences were aligned using MUSCLE (Edgar, 2004) using default settings (see File S1). Using the Model Selection tool in MEGA6 the JTT model (Jones, Taylor & Thornton, 1992) was identified as the best fit and a phylogenetic tree was constructed using the maximum likelihood method based on the JTT model with 1,000 bootstrap replicates. Additional alignments were produced for novel devil genes using the ClustalW algorithm (Thompson, Higgins & Gibson, 1994) in BioEdit (Hall, 1999).
Identification of immune transcripts
A list of immune transcripts in the milk transcriptome was generated by searching the milk transcriptome with proteins from the Immunome Database for Marsupials and Monotremes (IDMM) (Wong, Papenfuss & Belov, 2011) using tBLASTn. IDMM is a database of immune genes obtained from a number of marsupials including the tammar wallaby, gray-short tail opossum, brushtail possum, northern brown bandicoot (Isoodon macrourus), and the monotremes platypus (Ornithorhynchus anatinus) and echidna (Tachyglossus aculeatus). Additionally, the milk transcriptome was searched with a range of devil specific immune genes identified from the devil genome using BLAST. This included devil cytokines, immunoglobulin constant regions (Morris et al., 2015), NK cell receptors (Van Der Kraan et al., 2013), defensins (EA Jones, 2015, unpublished data) and cathelicidins (E Peel, 2015, unpublished data). The most highly expressed transcripts were selected based on FPKM expression estimates. Transcripts that had poor BLAST hits (E-value >1 × 10⁻¹⁰) to marsupial sequences in IDMM were verified using tBLASTx to the GenBank nucleotide collection or the devil genome on ENSEMBL.
Results
Transcriptome overview
A transcriptome was constructed and annotated from the total milk cells of a Tasmanian devil milk sample obtained at the end of mid-lactation. We note that Tasmanian devils are an endangered species and access to milk samples is opportunistic. In this case, a female devil was given veterinary treatment due to an injury and milk could be collected while she was anaesthetised. The total number of transcripts, including transcript variants, that were expressed in the milk transcriptome was 233,660. Excluding transcript variants, the number of transcripts was 101,399, and of these, 17,827 sequences had BLAST hits to the SwissProt non-redundant database. This number provides an estimate of the number of protein-coding genes within the Tasmanian devil milk transcriptome. Transcripts that were not protein-coding genes included non-coding RNAs, transposons, and retroelements. The transcriptome included 845 immune genes representing 4.7% of the protein-coding genes and accounted for 6.6% of the transcript expression in the transcriptome.
Of the 17,827 sequences with BLAST hits, GO terms were assigned to 16,437 transcripts. A total of 51 level 2 GO terms were assigned (Fig. 1) (see Table S2). Within the molecular function category, binding (60.6%) and catalytic activity (34.4%) were the most common functions. Of the biological processes, genes categorised as being involved in cellular processes (75.4%) were the most common, followed by metabolic processes (53.2%), biological regulation (40.0%), and developmental processes (27.0%).
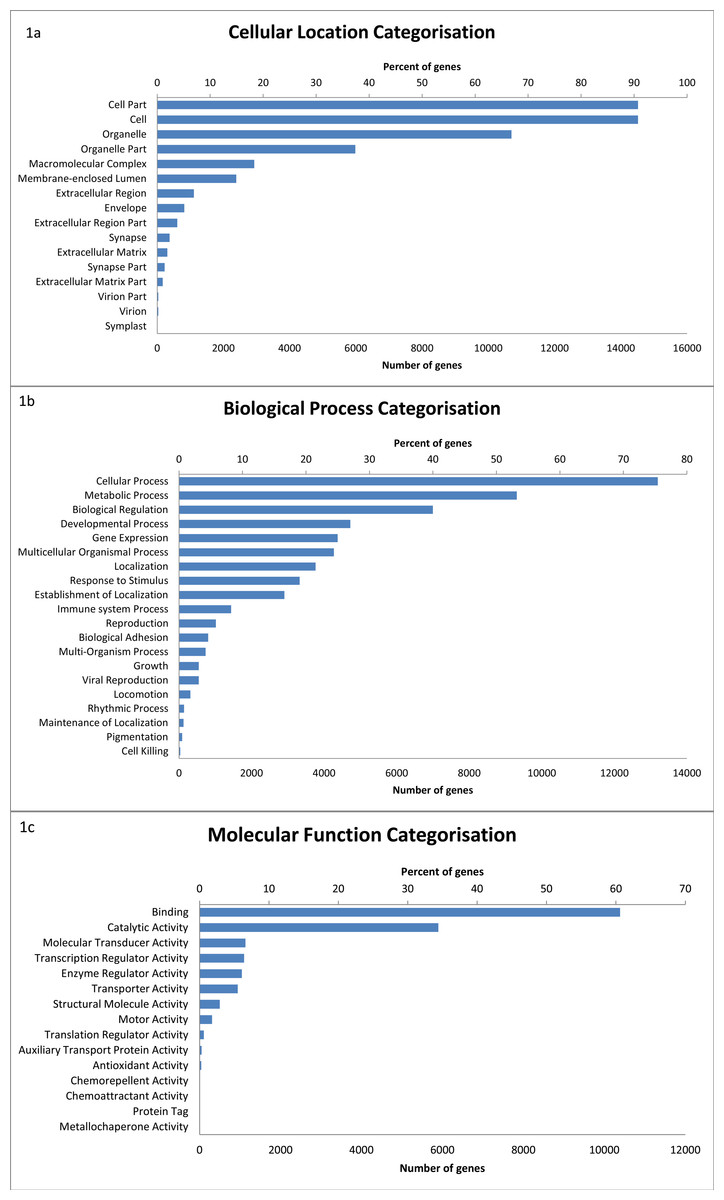
Figure 1: The distribution of GO terms in the devil milk transcriptome within the three level 2 GO categories of cellular location (A), biological process (B) and molecular function (C).
Percentage of genes show the proportion of transcripts under each category as a percentage of all GO annotated transcripts.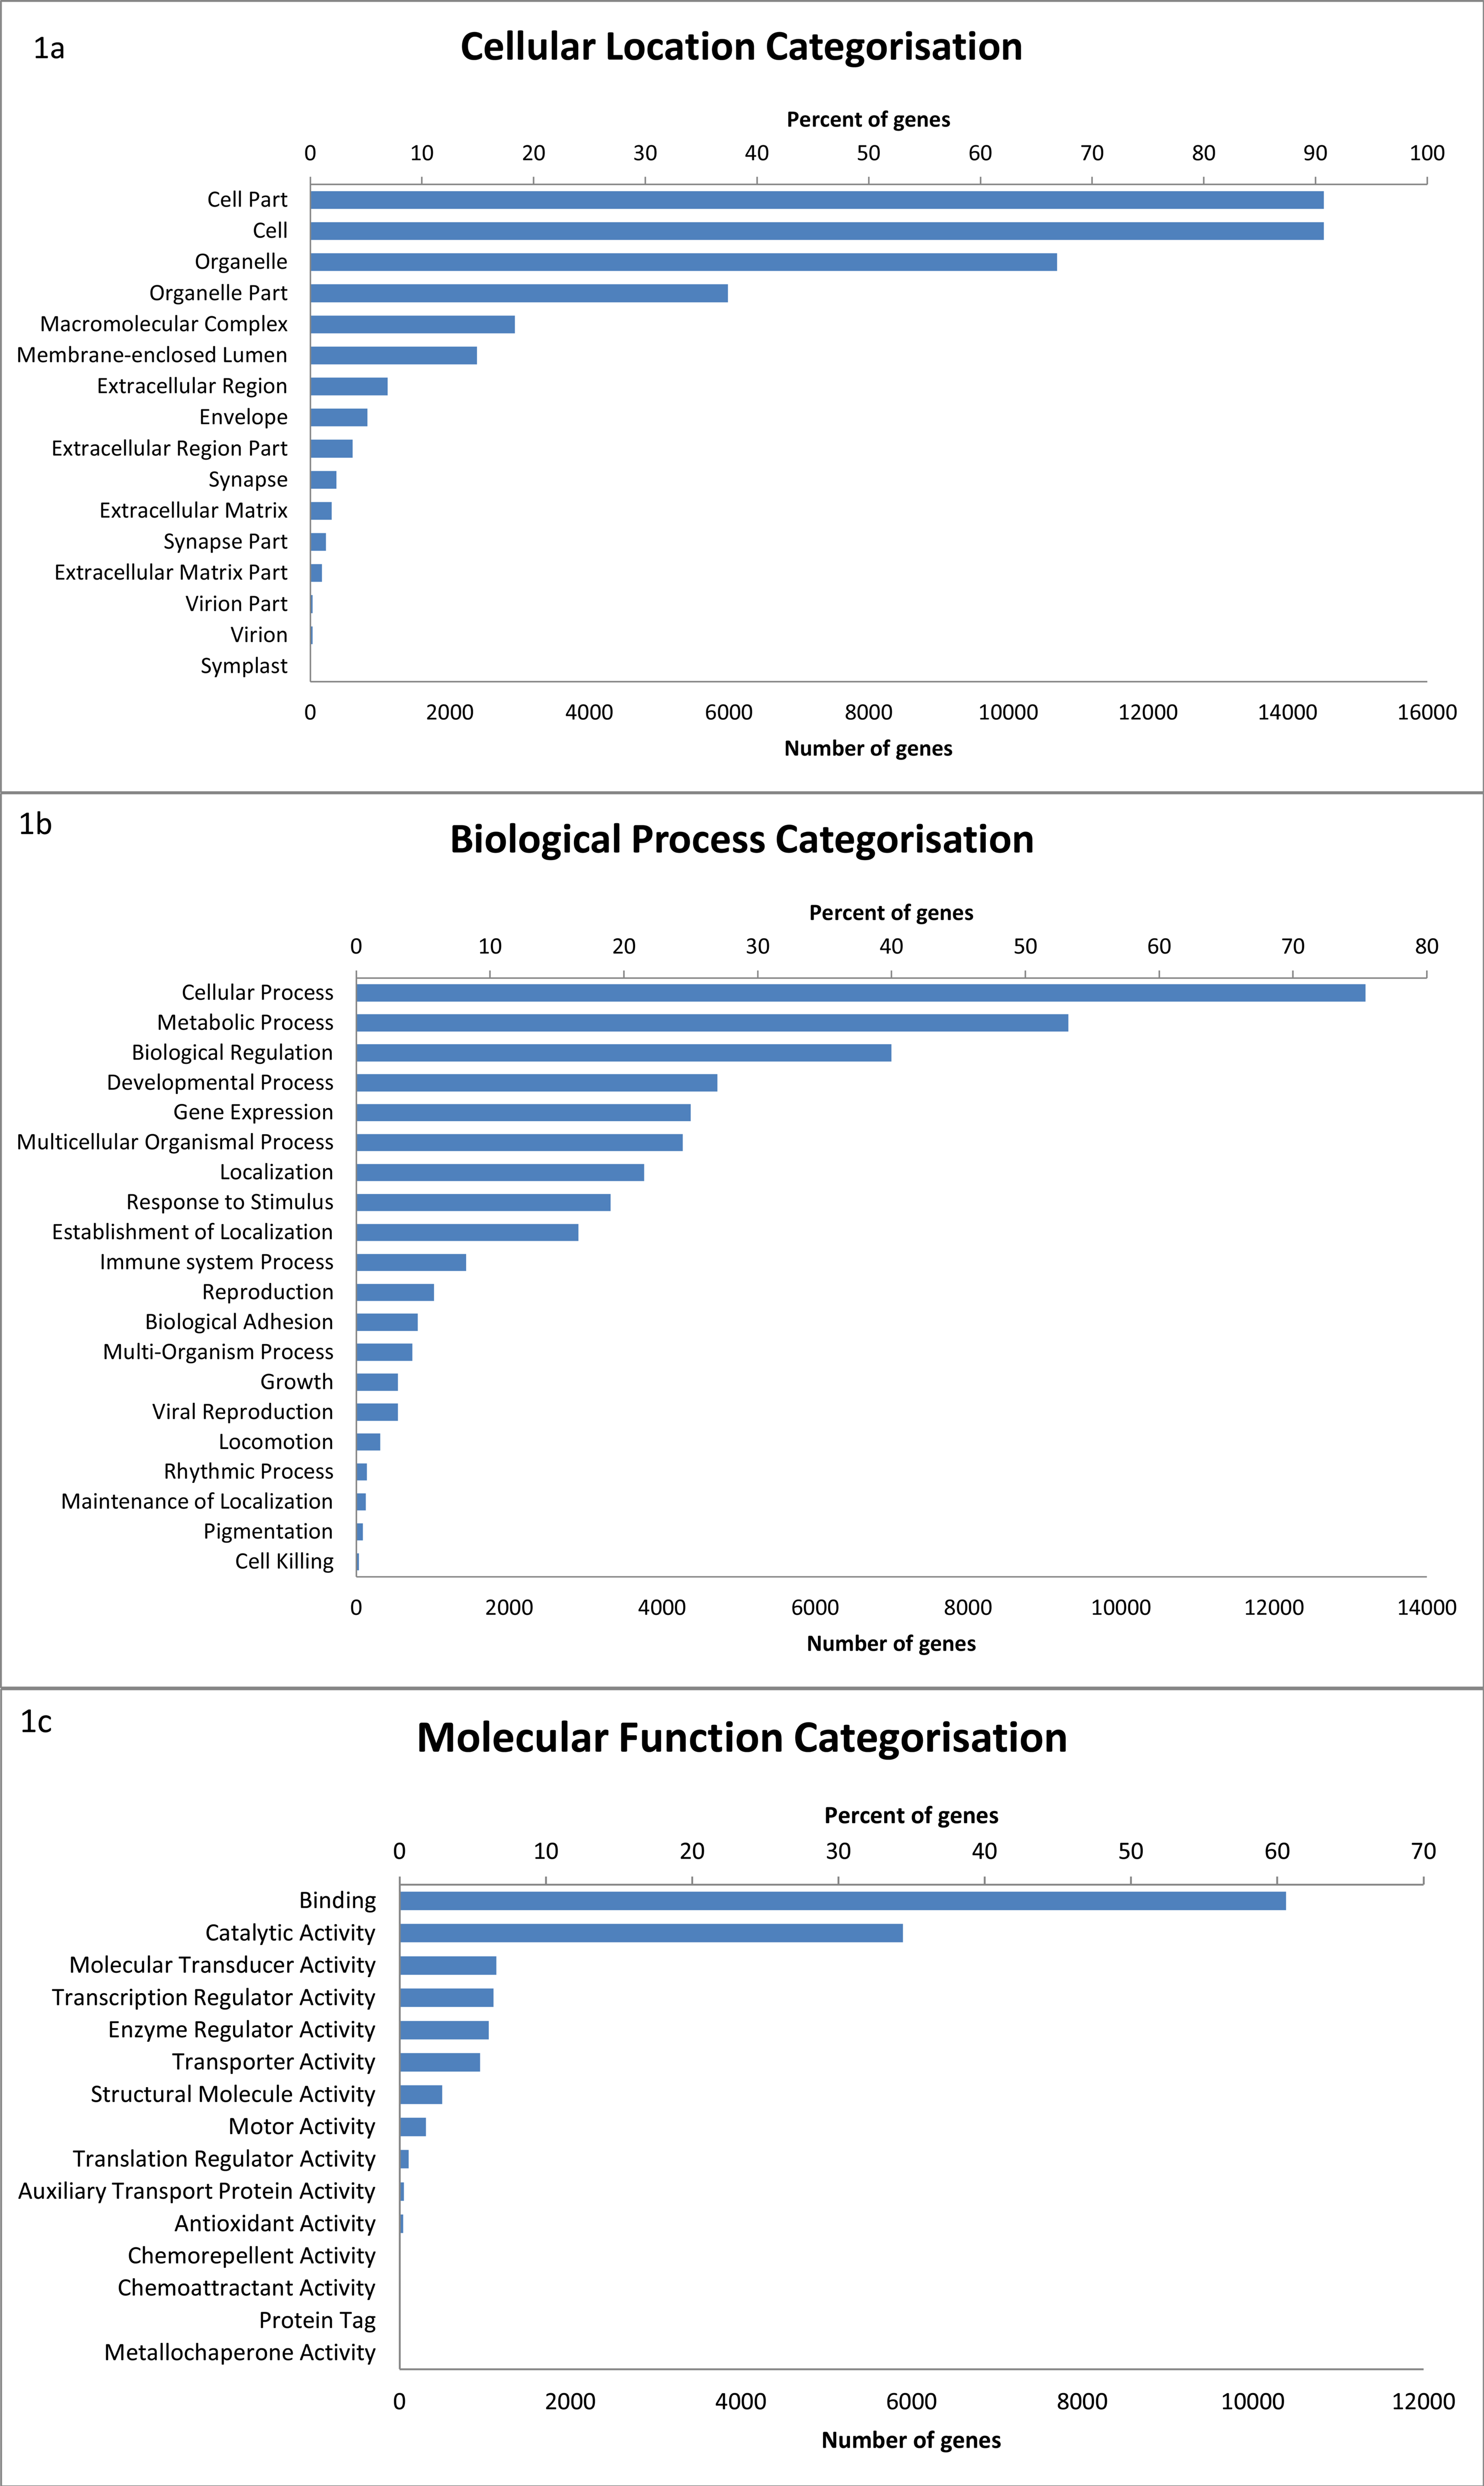
A large number of transcripts are also classified as having a role in immune system processes (8.2% or 1,341 transcripts). This number is slightly larger than the number of immune genes identified by BLAST to the IDMM database; this is likely due to a broader range of genes being classified as having a role in immune system processes within the GO annotation. Within the transcripts in the immune system process category, 14 sub-categories were represented (Fig. 2) (see Table S3). Of these transcripts, immune response genes were most common (55.5%), followed by immune system development (39.0%), leukocyte activation (37.5%) and immune effector process (24.9%).

Figure 2: Distribution of level 3 GO terms within the level 2 category of immune system process.
Percentage of genes show the proportion of transcripts under each category as a percentage of all GO annotated transcripts.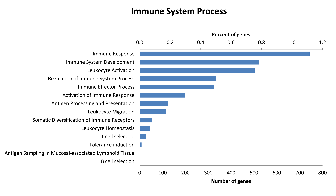
Most highly expressed transcripts
The 200 most highly expressed transcripts in the Tasmanian devil milk transcriptome encode a range of nutritional milk proteins and immune proteins (Fig. 3) (see Table S4). A large proportion of most highly expressed transcripts were milk protein transcripts common across most mammals, including α-, β-, and κ-caseins, α-lactalbumin, β-lactoglobulin and whey acidic protein (WAP), as well as the marsupial-specific milk proteins, early lactation protein (ELP) and late lactation proteins (LLP-A and LLP-B). These together accounted for 50.21% of the total gene expression and made up the majority of the ten most highly expressed transcripts (Table 1). These proteins are mostly involved in nutrition, providing amino acids and minerals to the young, although some also have potential immune roles (Oftedal, 2012). Transcripts for proteins associated with energy metabolism, such as nicotinamide adenine dinucleotide (NADH) dehydrogenase, adenosine triphosphate synthase lipid-binding protein, and cytochrome oxidases, are present in the top 200 highly expressed transcripts.
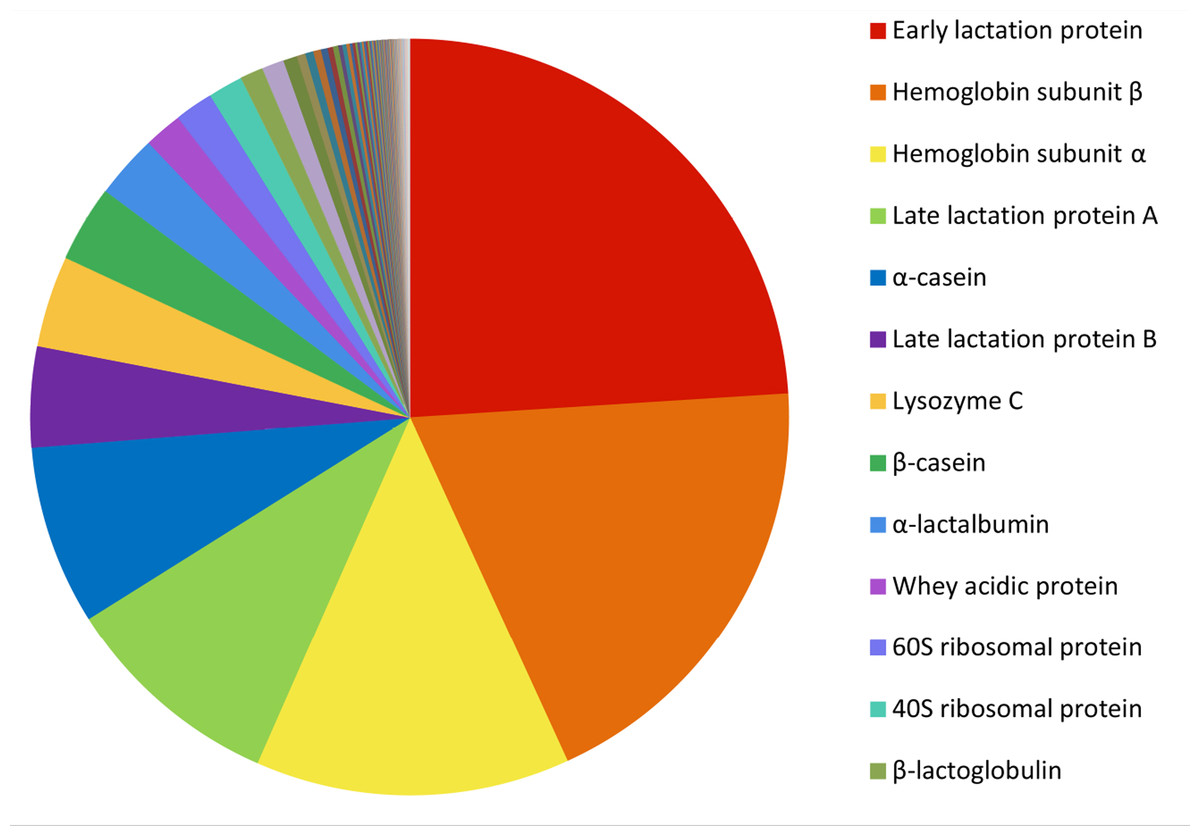
Figure 3: Relative abundance of the 200 most highly expressed transcripts.
The FPKM gene expression for each transcript was calculated as a percentage of the total FPKM expression of the top 200 most highly expressed transcript.
| Transcript Id | Gene | Gene name | Relative percentagea | Function | |
|---|---|---|---|---|---|
| 1 | comp129478 | ELP | Early lactation protein | 21.93 | Nutrition: nutrient reservoir activity |
| 2 | comp127295 | HBB | Haemoglobin subunit β | 17.53 | Cellular: oxygen transportation and iron binding |
| 3 | comp129479 | HBA | Haemoglobin subunit α | 12.26 | Cellular: oxygen transportation and iron binding |
| 4 | comp129480 | LLP-A | Late lactation protein A | 8.66 | Nutrition |
| 5 | comp62785 | CASA1 | α-casein | 7.01 | Nutrition |
| 6 | comp127104 | LLP-B | Late lactation protein B | 3.91 | Nutrition |
| 7 | comp62784 | LYZ | Lysozyme C | 3.58 | Immune: bacterial defence, cytolysis |
| 8 | comp129483 | CSN2 | β-Casein | 2.98 | Nutrition: calcium iron binding |
| 9 | comp129482 | LALBA | α-Lactalbumin | 2.49 | Nutrition: lactose synthase activity/calcium iron binding |
| 10 | comp129481 | WAP | Whey acidic protein | 1.50 | Nutrition |
Notes:
The highest expressed transcript was ELP, accounting for 21.93% of all transcripts. LLP-A and LLP-B were also highly expressed, as the fourth and sixth most highly expressed transcripts respectively, representing 8.66% and 3.91% of the total gene expression respectively (Table 1). The transcriptome contained a third transcript with homology to LLP-A and -B, named LLP-like, which may represent a novel Tasmanian devil LLP. To investigate the relationships between LLP-like and other Tasmanian devil and marsupial LLPs, a phylogenetic tree was constructed (Fig. 4). The number of LLP genes appears to differ between species; while a single LLP sequence has been identified in quokka and brushtail possum, two have been identified in wallaby. Through BLAST searches to the opossum genome, four opossum LLP homologs were identified in the opossum. The evolutionary relationship between Tasmanian devil LLP-like with other marsupial LLP sequences could not be definitively resolved due to weak bootstrap support. However, LLP-like does group with the other marsupial LLP sequences, and shares substantial amino acid sequence identity with other marsupial LLP sequences (23.2–44.6%), thus this sequence is likely to represent an additional LLP locus in the devil.

Figure 4: Phylogenetic tree illustrating the evolutionary relationship between LLP homologs amongmarsupials.
The Tasmanian devil has three LLP homologs (LLP-A, LLP-B and LLP-like). The tree was constructed using the maximum likelihood approach and the JTT model with bootstrap support values from 1,000 bootstrap tests. Red circle, Tasmanian devil; Blue circle, Tammar wallaby; Pink circle, quokka; Green circle, gray short-tailed opossum; Yellow circle, Brushtail possum.
Novel transcripts
Two novel gene transcripts were identified in the top 200, ranking 27th and 58th and accounting for 0.26% and 0.02% of the total gene expression respectively (see Table S5). Conserved motifs could not be identified in either gene. The first novel gene, which we designate here as novel gene 1, contained three exons that aligned to the Tasmanian devil genome, however there was no gene prediction made by the ENSEMBL annotation in this region. It did contain a predicted signal peptide cleavage site and a polyA tail, suggesting that it encodes a protein. A putative ortholog to novel gene 1 was identified in the tammar wallaby mammary gland transcriptome (Genbank: EX196900.1). The nucleotide and protein alignments of the devil and wallaby sequences are shown in Figs. 5 and 6. The two sequences have 64% and 68% nucleotide and amino acid identity respectively. Given that a homolog could not be identified in eutherians or non-mammals and that transcripts of this gene could only be identified in milk or mammary transcriptomes, we propose that novel gene 1 may have a marsupial-specific role in lactation.
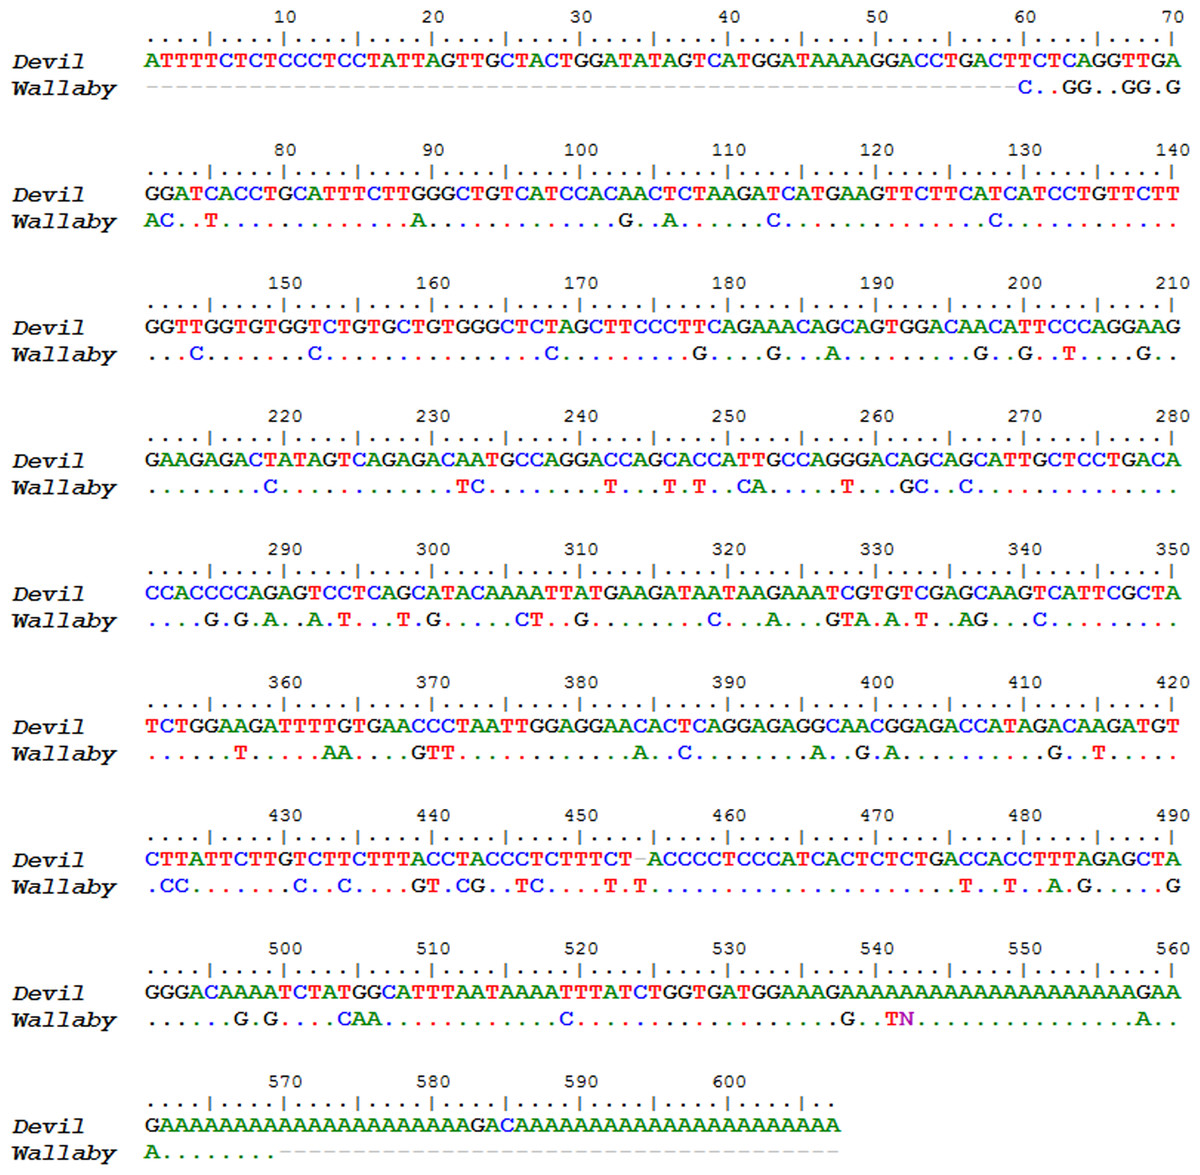
Figure 5: Nucleotide sequence alignment of devil Novel Gene 1 against the tammar mammary gland homolog.
Dots indicate identity to devil sequence.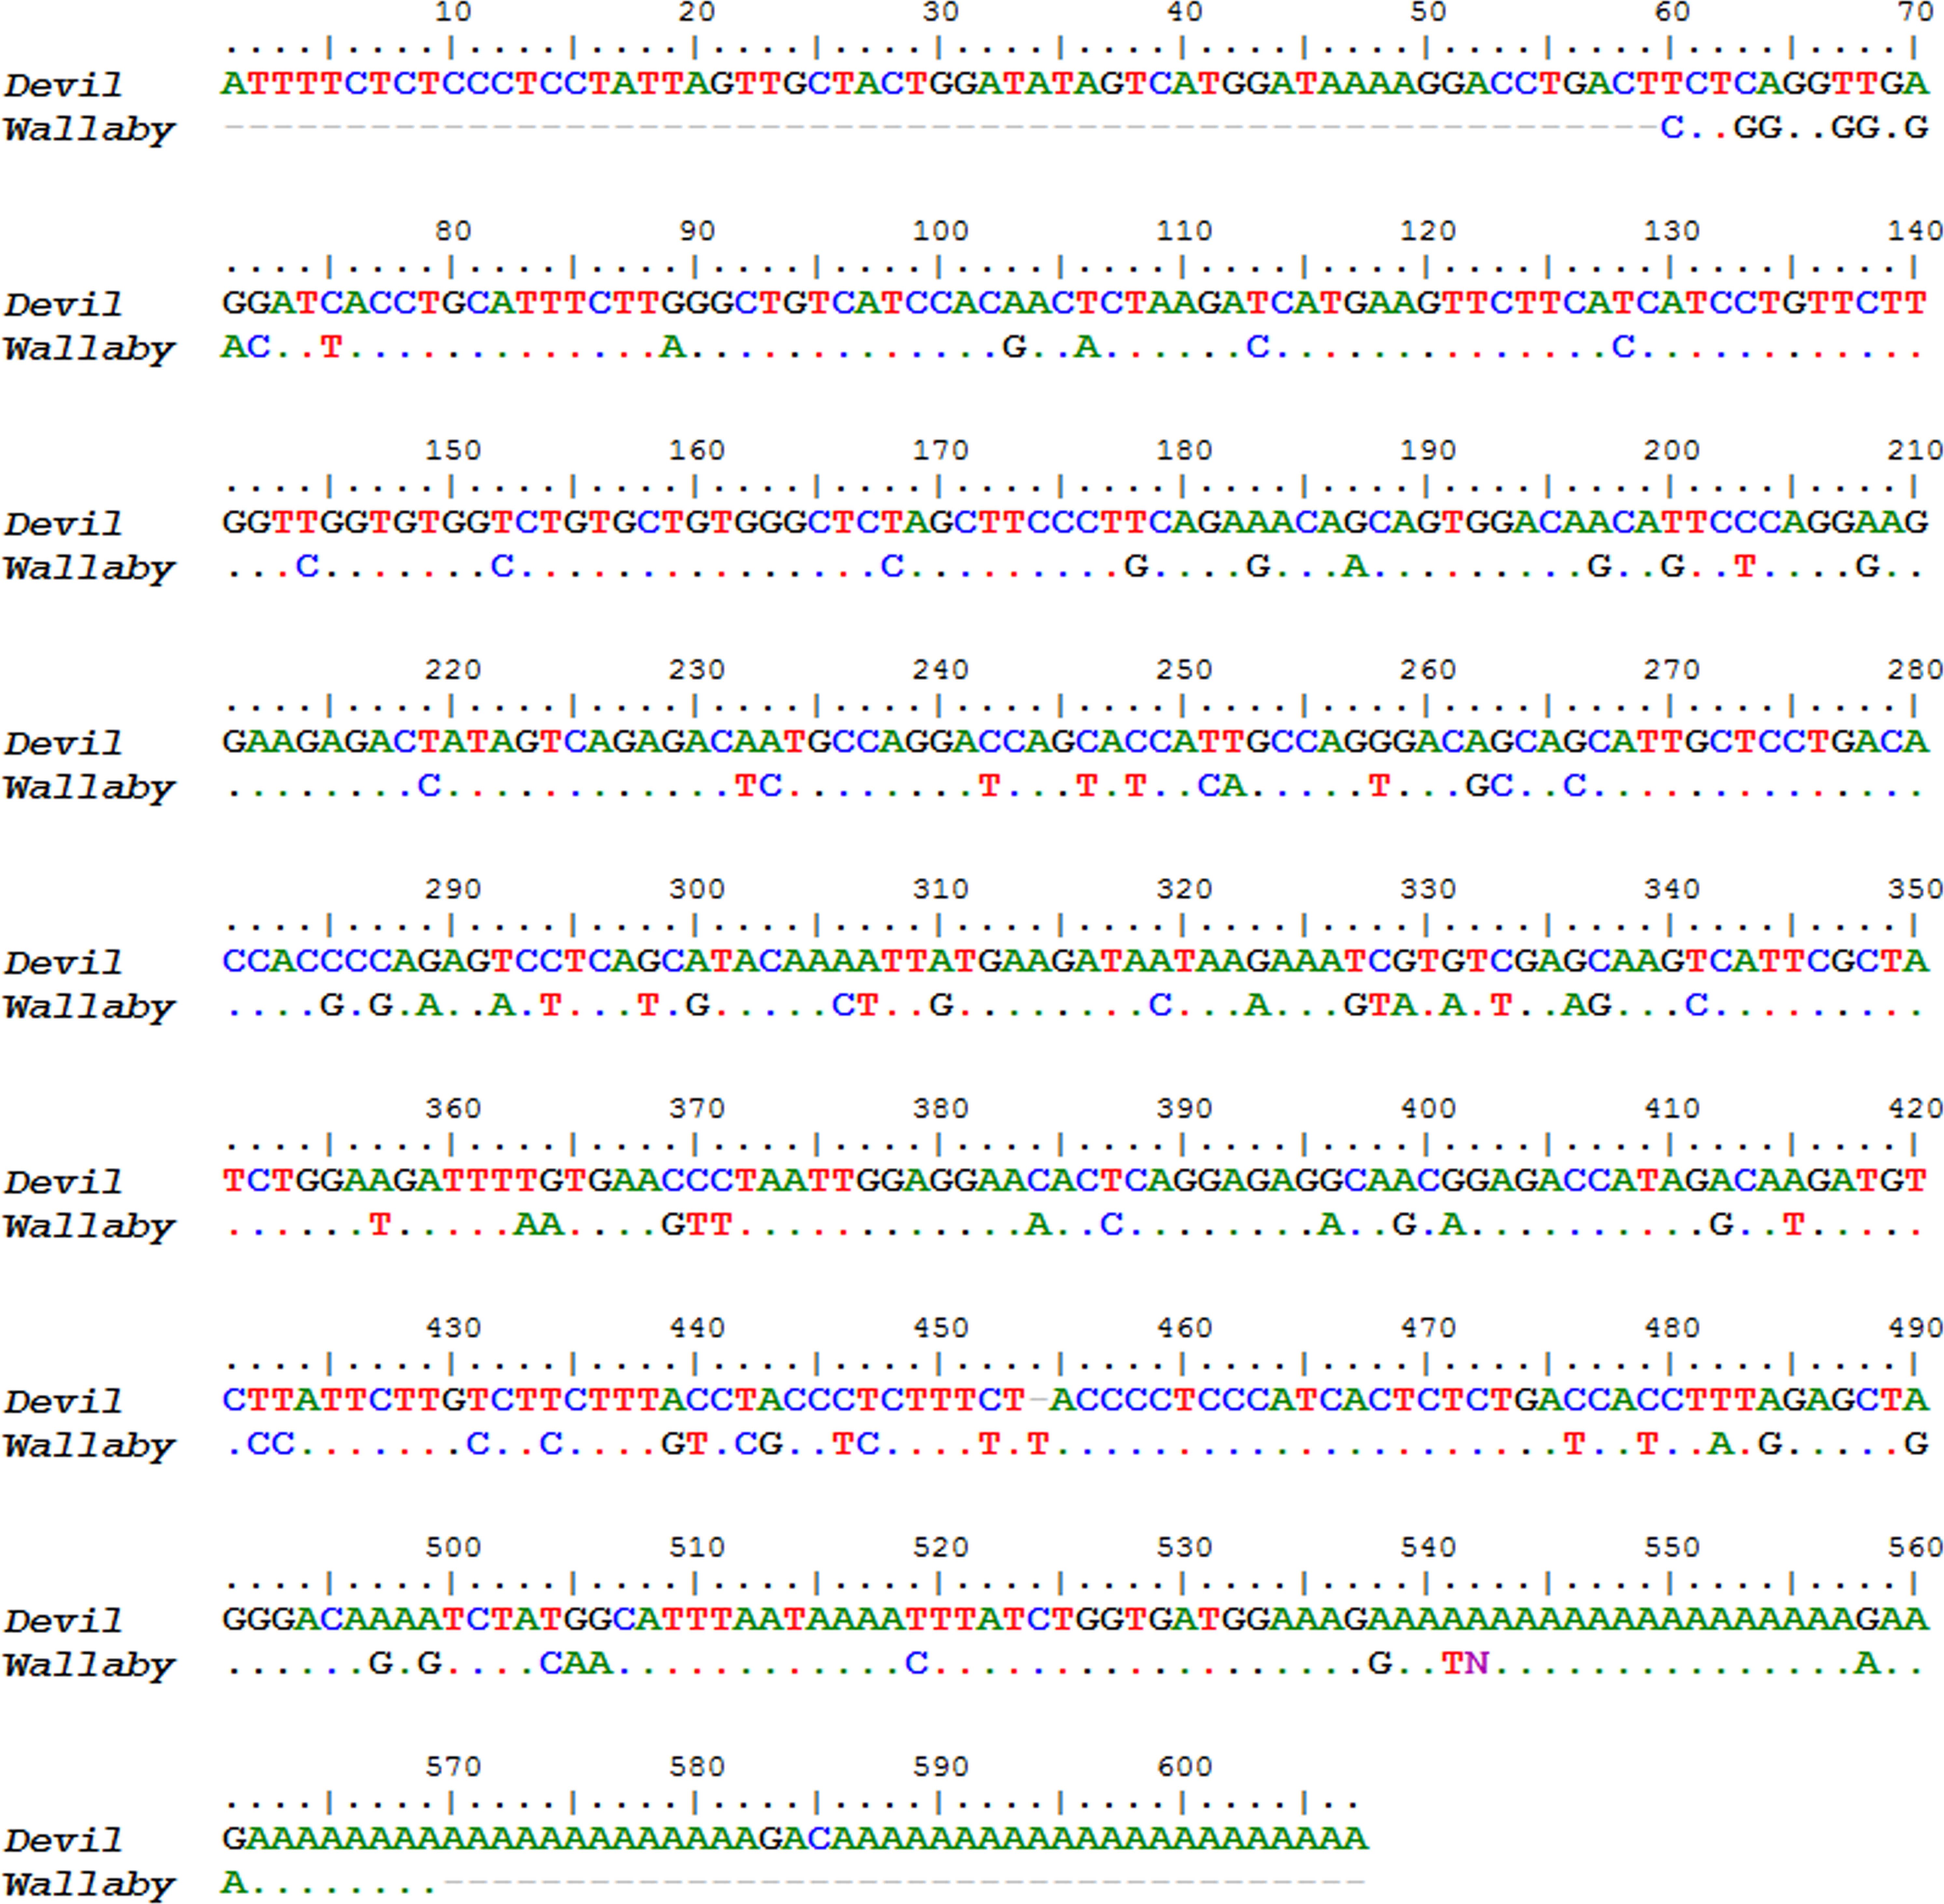
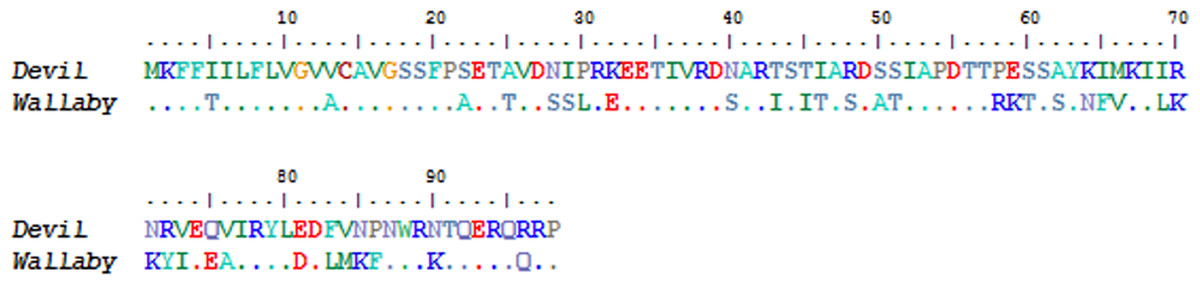
Figure 6: Amino acid sequence alignment of devil Novel Gene 1 against the tammar mammary gland homolog.
Dots indicate identity to devil sequence.
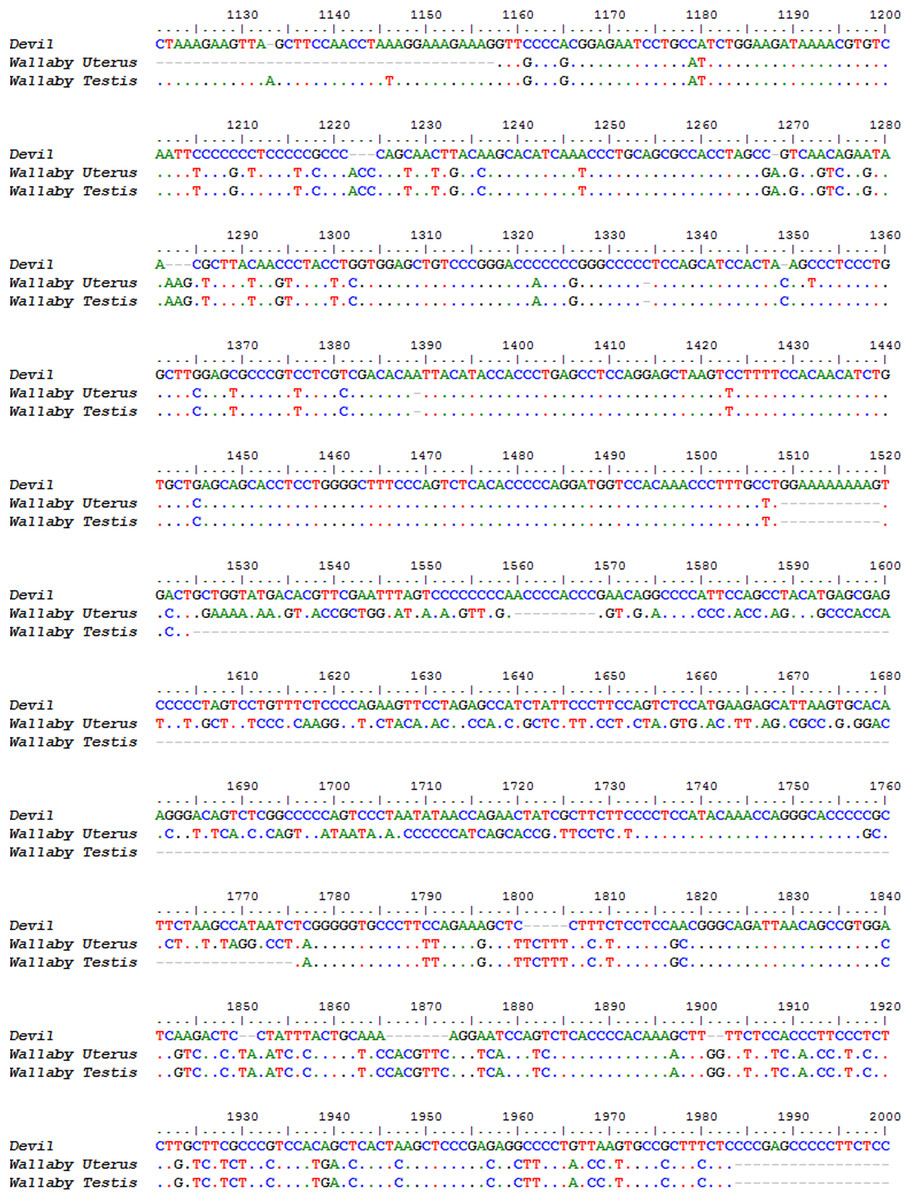
Figure 7: Nucleotide alignment of devil Novel Gene 2 alignment to the tammar wallaby testis and uterus homologs.
Alignment begins from position 1,040 in the devil sequence. Dots indicate identity to devil sequence.
The second novel gene did not contain a signal peptide cleavage site. There were no gene predictions in the region encoding this sequence in the devil genome, nor homologs identified through HMMER searches. Additionally, the transcript is 2,072 base pairs long but does not contain any open reading frames greater than 90 residues, thus it seems unlikely to be protein-coding. Based on the length and the lack of open reading frames we speculate that it may be a long regulatory RNA. Two possible homologous sequences were identified in the tammar testis (E value: 4 × 10161) and tammar uterus (E-value: 0.00) transcriptomes through BLAST. Their alignment against the Tasmanian devil nucleotide sequence is shown in Fig. 7. The devil sequence has a sequence identity of 28.9% to the tammar testis and 27.8% to the tammar uterus sequences. Although this is quite low overall, there are regions within the sequences with very high identity, for example bases 1,156 to 1,499 in the devil sequence have 86.8 and 87.4% identity to the wallaby uterus and testis sequences respectively.
Immune transcripts in the milk
There were 846 immune gene transcripts identified in the milk transcriptome, representing 6.6% of the total gene expression. The top ten are listed in Table 2, and the relative expression of the top 200 immune transcripts is shown in Fig. 8 (see Table S6). The most highly expressed immune transcripts include those encoding lysozyme C, WAP, ferritin, MHC I, S100A (calcium-binding) proteins, and CCL25.
| Transcript Id | Gene | Protein | Relative percentagea | Immune function | |
|---|---|---|---|---|---|
| 1 | comp62784 | LYZ | Lysozyme C | 3.58 | Defence again bacteria, inflammatory response. Important part of innate immunity (Nicholas et al., 1989) |
| 2 | comp129481 | WAP | Whey acidic protein | 1.50 | Potential protease inhibitor (Nicholas et al., 1997) |
| 3 | comp62802 | FTH1 | Ferritin heavy subunit | 0.30 | Iron storage and sequestering iron (Brock, 1980; Demmer et al., 1999) |
| 4 | comp129487 | FTL | Ferritin light subunit | 0.21 | Iron storage and sequestering iron (Brock, 1980; Demmer et al., 1999) |
| 5 | comp129504 | AZGP1 | Zinc-alpha-2-glycoprotein | 0.08 | Potential role antigen binding (Sanchez, López-Otín & Bjorkman, 1997) |
| 6 | comp129394 | MHC I | Major histocompatibility complex class I | 0.07 | Binds to antigens and stimulation of the immune response (Chaplin, 2010) |
| 7 | comp129498 | S100A9 | S100 calcium binding protein A9 | 0.07 | Important regulatory roles in inflammatory immune response. It can induce neutrophil chemotaxis and adhesion and promote phagocytosis (Ryckman et al., 2003) |
| 8 | comp62779 | CLC25 | Chemokine (C-C motif) ligand 25 | 0.06 | CCL25 induces chemotaxis of thymocytes, macrophages, and dendritic cells (Vicari et al., 1997) |
| 9 | comp129492 | TPT1 | Translationally-controlled tumour protein | 0.04 | TCTP is involved in microtubule stabilization, calcium-binding activities, and apoptosis (Bommer & Thiele, 2004) |
| 10 | comp127370 | B2M | β-2-microglobulin | 0.04 | β-chain of MHC I: serum protein associated with major MHC I heavy chain (Adamski & Demmer, 1999; Gussow et al., 1987) |
Notes:
Figure 8: Relative abundance of the 200 most highly expressed immune transcripts.
The FPKM gene expression for each immune transcript was calculated as a percentage of the total FPKM expression of the top 200 most highly expressed transcript.
All four isotypes of marsupial Igs were present in the devil milk transcriptome, consistent with the gene expression profile in the tammar wallaby during mid-lactation (Lefevre et al., 2007) (Table 3). The total relative expression of all Ig transcripts was 0.01%. Transcripts encoding IgM, IgG and IgE were also present in the milk transcriptome but at lower abundance, representing 9.99 × 10⁻⁴%, 4.29 × 10⁻⁴% and 2.21 × 10⁻⁵% of the total expression respectively. Two Ig light chain isotypes, Igκ and Igλ1 were identified, with Igκ being the most highly expressed (Table 3). Four Igλ light chains have been identified in the Tasmanian devil (Morris et al., 2015), however only Igλ1 was identified in the milk. Additional receptors involved in transfer and protection of Igs were also identified. β-2 microglobulin light chain (β-2), a receptor important for efficient transfer and uptake of IgG across the PY gut (Daly et al., 2007; Joss et al., 2009) was highly expressed in the devil milk transcriptome. Polymeric immunoglobulin receptor (pIgR), which protects Ig in the gut and has antimicrobial properties (Kaetzel, 2005), was also very highly expressed.
| Transcript Id | Gene | Relative percentagea | |
|---|---|---|---|
| 1 | comp128499 | Ighκ | 5.79 × 10⁻³ |
| 2 | comp127776 | IgA | 1.96 × 10⁻³ |
| 3 | comp127776 | IgM | 9.99 × 10⁻⁴ |
| 4 | comp127776 | IgG | 4.29 × 10⁻⁴ |
| 5 | comp12845 | Igλ1 | 1.64 × 10⁻⁴ |
| 6 | comp78451 | IgE | 2.21 × 10⁻⁵ |
Notes:
A range of immune cell receptor genes were expressed in the milk transcriptome, providing insights into the cell types that are likely to have been in the sample at the time of collection. Phagocytes, macrophages, dendritic cells, monocytes, granulocytes, T helper and cytotoxic T cells were likely to be present based on the expression of two MHC class II β transcripts and MHC II α transcripts (Ting & Trowsdale, 2002), numerous toll-like receptors (1, 4, 5, 7, 8 and 9) (Akira, Takeda & Kaisho, 2001), CD14, (Taylor et al., 2005) CD4 (Doyle & Strominger, 1987) and CD8 (Gibbings & Befus, 2009).
Ten natural killer receptor (NKR) transcripts (Table 4) and 18 chemokine gene transcripts were identified in the milk transcriptome (Table 5). CCL25, IL8, CXCL1L and CCL28 were the most highly expressed (Table 5). Antimicrobial peptides were also present (Table 6). This included four cathelicidins and three β-defensins.
| Transcript Id | Gene | Relative percentagea | |
|---|---|---|---|
| 1 | comp145309 | Dig9 | 2.09 × 10⁻³ |
| 2 | comp129464 | Dig1 | 1.57 × 10⁻³ |
| 3 | comp124809 | Dig3 | 1.18 × 10⁻³ |
| 4 | comp124376 | Dig21 | 8.45 × 10⁻⁴ |
| 5 | comp106701 | Dig5 | 5.22 × 10⁻⁴ |
| 6 | comp128578 | Dig4 | 2.34 × 10⁻⁴ |
| 7 | comp128741 | Dig23 | 1.84 × 10⁻⁴ |
| 8 | comp114623 | Dig11 | 3.57 × 10⁻⁵ |
| 9 | comp114366 | Dig15 | 1.92 × 10⁻⁵ |
| 10 | comp136274 | Dig16 | <1 × 10⁸ |
Notes:
| Transcript Id | Gene | Relative percentagea | |
|---|---|---|---|
| 1 | comp62779 | CCL25 | 0.06 |
| 2 | comp124292 | IL8 | 1.50 × 10⁻² |
| 3 | comp115841 | CXCL1L | 4.47 × 10⁻³ |
| 4 | comp63052 | CCL28 | 2.03 × 10⁻³ |
| 5 | comp63043 | CCLD13 | 4.32 × 10⁻⁴ |
| 6 | comp125502 | CCLD14 | 3.69 × 10⁻⁴ |
| 7 | comp122269 | CCL24 | 1.73 × 10⁻⁴ |
| 8 | comp130761 | CXCL10A | 1.48 × 10⁻⁴ |
| 9 | comp63705 | CCLD4 | 1.05 × 10⁻⁴ |
| 10 | comp129405 | CCLD9 | 9.24 × 10⁻⁵ |
| 11 | comp115375 | CCLD1 | 8.72 × 10⁻⁵ |
| 12 | comp121731 | CCLD15 | 8.02 × 10⁻⁵ |
| 13 | comp125502 | CCLD6 | 4.97 × 10⁻⁵ |
| 14 | comp119846 | CXCL5L | 4.97 × 10⁻⁵ |
| 15 | comp60658 | XCLA | 4.71 × 10⁻⁵ |
| 16 | comp132809 | CXCL9 | 4.01 × 10⁻⁵ |
| 17 | comp141960 | CCLD2 | 2.53 × 10⁻⁵ |
| 18 | comp51233 | CCLD3 | 2.01 × 10⁻⁵ |
Notes:
| Transcript id | Gene | Relative percentagea | |
|---|---|---|---|
| 1 | comp62677 | CATH2 | 1.11 × 10⁻³ |
| 2 | comp122064 | CATH7 | 1.09 × 10⁻⁴ |
| 3 | comp125957 | CATH6 | 1.46 × 10⁻⁴ |
| 4 | comp115402 | CATH1 | 4.62 × 10⁻⁵ |
| 5 | comp120278 (seq2) | β-defensin 1 | 5.58 × 10⁻⁵ |
| 6 | comp120278 (seq4) | β-defensin 2 | 2.70 × 10⁻⁵ |
| 7 | comp50770 | β-defensin 5 | 1.57 × 10⁻⁵ |
Notes:
Discussion
In this study we have examined the milk of the Tasmanian devil for the first time. Through transcriptomic analysis of milk at mid-lactation we add to the growing body of knowledge on the composition of marsupial milk, which has previously largely focussed on just two species, wallaby and possum. We have examined the devil milk during a period of increased exposure to novel pathogens, allowing us to examine the immune components that protect young during this time.
The expression of nutritional compounds in the mid-lactation milk of the devil was very similar to what has been previously observed in marsupials. Major milk proteins, previously found to be highly expressed in eutherian and marsupial milk, including caseins, β-lactoglobulin, and α-lactalbumin, were found to be highly expressed in the devil milk, as expected. However several interesting differences were observed. Compared to the wallaby, expression of caseins, α-lactalbumin and β-lactoglobulin were considerably lower in the present study (2.49% and 0.89% respectively) than in the wallaby (4.5% and 13.4% respectively (Lefevre et al., 2007)), while the expression of ELP and LLP were far higher. ELP and LLPs are phase-specific lactation proteins unique to marsupials, being expressed in early and late lactation respectively (Demmer et al., 1998; Joss et al., 2009). In the Tasmanian devil mid-lactation milk, ELP was the most highly expressed transcript accounting for 21.93% of all transcripts while LLP-A and LLP-B represented 8.66% and 3.91% of the total gene expression respectively. The expression of these proteins was much higher in the devil milk than in the tammar wallaby mammary gland at mid-lactation, where ELP and LLP-A accounted for only 0.5% and 0.1% of transcript expression respectively, and LLP-B was not detected at mid-lactation at all (Lefevre et al., 2007). This is the first time high expression of ELP and LLP has been observed at the same time in a marsupial.
While all these proteins may play a role in nutrition (Oftedal, 2012), the roles they play in marsupial lactation has not been clearly established. It is possible that devils and wallabies are recruiting different proteins to fulfil the amino acid requirements of their PY, or that the differences in expression are due to additional functions of these proteins, for example several of these proteins are believed to play an immune role. ELP is likely to be a protease inhibitor, acting to prevent Ig degradation in the gut of the young (Pharo et al., 2012) while β-lactoglobulin can be digested into anti-bacterial peptides in the gut (Jenness, 1986; Pellegrini et al., 2001).
Interestingly, the transcriptome contained a third transcript with homology to LLP-A and-B, named LLP-like, which may represent a novel Tasmanian devil LLP. The number of LLP-related proteins discovered varied between marsupials, from one in the possum to four in the opossum. It appears this gene family is rapidly evolving and different genes may have different functions across marsupial species.
The expression of trichosurin, a marsupial-specific protein with unknown function, was much lower in the devil (0.04%) than in the wallaby (1.80%) (Lefevre et al., 2007) at mid-lactation. This finding supports the previous suggestion that the primary role of trichosurin is in enabling digestion of plant-derived phenolic compounds when marsupial young move onto a solid diet (Watson et al., 2007). As devils are omnivores, they have a much lower percentage of plant-based materials in their diet than herbivorous wallabies.
In terms of immune gene content, there were many commonalities between the Tasmanian devil milk and wallaby mammary mid-lactation transcriptomes, illustrating that similar mechanisms provide immune protection to the young at this stage. All four immunoglobulin (Ig) isotypes were identified. As in the wallaby and possum, IgA was the most highly expressed immunoglobulin in the devil mid-lactation milk, and is likely to have a key role in protecting the gut of the young (Adamski & Demmer, 2000; Daly et al., 2007). Proteins involved in transfer and protection of Igs, including WAP, B2M and pIgR were also highly expressed. Chemokines, such as CCL28, and antimicrobial peptides including cathelicidins, known to have direct antimicrobial function in milk, were identified in the devil milk. Cathelicidins in wallaby milk have been shown to be highly potent and inhibit the growth of opportunistic pathogens such as Salmonella enterica (Pasupuleti, Schmidtchen & Malmsten, 2012; Wang et al., 2011; Wanyonyi et al., 2013; Wanyonyi et al., 2011), thus these peptides likely play a crucial role in protecting devil young from ingested bacterial and fungal species. Macrophages, lymphocytes, and neutrophils are likely present in the milk samples at varying levels based on the presence of immune receptor molecules.
The most notable difference between the immune components of wallaby and devil mid-lactation transcriptomes was the very high expression of Lysozyme C, which plays an important role in innate immunity by breaking down glycosidic linkages in bacterial cell-wall polysaccharides, resulting in bacterial cell lysis (Nicholas et al., 1989; Piotte et al., 1997). In the devil mid-lactation milk it was the 7th most abundant transcript, while its presence was not reported in the wallaby mammary transcriptome (Lefevre et al., 2007). This may indicate that Lysozyme C is more significant in the protection of devil young than wallaby young, possibly due to the higher pathogen load in the diet of devils which is largely comprised of scavenged carcasses (Owen & Pemberton, 2005).
We note that a limitation of this study is that only one sample could be obtained (as we collected opportunistically), and thus the findings cannot be generalised across all devil milk from this period. However, previously it was shown in the tammar wallaby milk transcriptome that the composition of samples collected on the same day of lactation were highly similar (Lefevre et al., 2007). Therefore it is likely that our sample is a reasonable representation of mid-lactation milk in the devil, one of the two critical immune periods for marsupial young (Daly et al., 2007). It would also be of interest to examine the components of the first critical immune period, which is during the first 48 h after birth (Daly et al., 2007); however, this would be a highly challenging sample to obtain without risking death of the offspring and is not currently permitted in the captive animals we work with, due to the need to grow the population for release into the wild.
This study has provided valuable insight into the gene expression profile of Tasmanian devil milk during mid-lactation. We have characterised a range of immune proteins crucial for protection of devil joeys during this vulnerable stage.
Supplemental Information
Alignment of LLP sequences for phylogenetic tree construction
Allocation of genes to GO categories for cellular location, biologicalprocess and molecular function
Number of genes and percentage of genes relative to all GO annotated genes within the three categories level 1 GO categories.
Immune gene allocation to GO “Immune Processes” categorization
Number of genes and percentage of genes relative to all GO annotated genes within the immune processes categories.
The 200 most highly expressed transcripts in the milk transcriptome
The most highly expressed transcripts including key milk protein and immune transcripts and their relative expression (FPKM).
Novel gene transcripts
The relative expression of the two novel gene transcripts (gene expression as a percentage of the total gene expression of the entire transcriptome).
Immune transcripts identified in the milk transcriptome
All immune transcripts identified in the milk transcriptome and their relative expression (FPKM).