Pivot Points are a type of support and resistance levels that are used by many intraday and short term traders. When trading pivot points, many of the same rules are in force as with other types of support and resistance trading techniques.
Many traders keep a watchful eye on daily pivot points, as they are considered to be key levels at the intraday timeframe. We will go through the basic aspects of Forex Pivot Points and we will discuss a couple trading strategies that can be used with daily pivot points.
What are Forex Pivot Points?
Forex pivot points are calculated horizontal price levels on the chart. These levels show potential areas where the price can reverse, especially during the first touch of these levels. Many Forex traders make their intraday trading decisions based on daily pivot levels, and as such it is important for intraday traders to watch price action at these levels closely.
How to Calculate Pivot Points
The Standard Pivot point calculation is quite simple. It requires only three numbers – close, high, and low.
We should first calculate the main daily pivot point. The formula for this:
Pivot Point (PP) = (Daily High + Daily Low + Close) / 3
Since the Forex market is a 24/5 market, there is some confusion as to which time to use for the daily market opening and closing. Most forex traders use the 11:59 PM (23:59) GMT for Forex market closing time and 12:00 AM (00:00) GMT for Forex market opening time. By doing this you can separate the daily trading sessions from each other.
When you get the PP, you can start calculating the further upper and lower pivot points. These are called first, second, third pivot resistance levels, and first, second, third, pivot support levels.
Calculating the First Pivot Resistance and Support
Since you now have the basic pivot point, you can now calculate the first support and resistance.
R1 = (2 x Pivot Point) – Daily Low
S1 = (2 x Pivot Point) – Daily High
Calculating the Second Pivot Support and Resistance
R2 = Pivot Point + (Daily High – Daily Low)
S2 = Pivot Point – (Daily High – Daily Low)
Calculating the Third Pivot Point Support and Resistance
R3 = Daily High + 2 x (Pivot Point – Daily Low)
S3 = Daily Low – 2 x (Daily High – Pivot Point)
We have gone thru the calculations above so that you can understand how these levels are calculated. We will now discuss some quick ways to calculate pivot points without having to do the manual calculations daily.
Adding Pivot Points to Your Chart
When you apply the basic pivot point and the three support and resistances, there will be 7 different levels. As you have seen above, it can be a bit tedious to perform the calculations manually. There are different options to get the pivot points without doing the calculations above manually.
Pivot Points Calculator
There are many online pivot point calculators on the net. When you open a pivot point calculator, you will be required to add the three price action variables. These are the daily high, the daily low and the close. When you add these three, you will simply click on a “calculate” button and you will instantly get your pivot points. Once you have that, then you could just plot the pivot lines on your trading chart within your trading platform.
Pivot Point Indicator
Most of the trading software available today will have a pivot indictor that will calucatate these levels for you automatically and plot them on your chart. First, check the list of indicators your trading platform offers. If you don’t have a pivot indicator there, you should do some research.
You can find many Pivot Point Indicators online, which you could simply add to your platform. Browse the net and you will definitely find a pivot point indicator available usually for free somewhere. You may have to import the indicator and then extract the files in the indicators folder of your trading platform. Once you have done this, you will be able to apply the pivot point indicator directly on your chart. When you plot your pivot point indicator on your chart, you should see something like this:
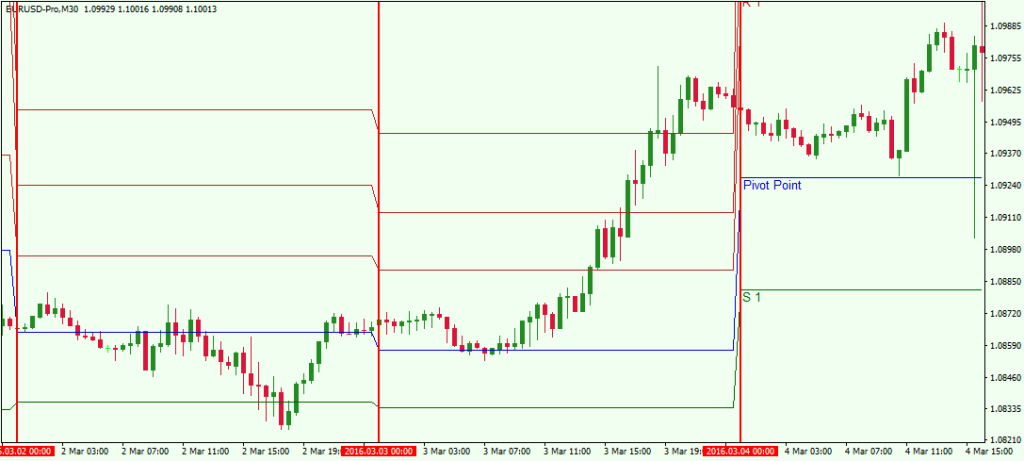
This is the 30 minute chart of the EUR/USD March 2, 3, and 4, 2016. The horizontal lines on the chart are the pivot points. The blue line is the central pivot point. The lines above the main pivot point are R1, R2, and R3. The lines below the blue line are S1, S2 and S3, (S2 and S3 are not visible). We also put three vertical lines on the chart. These three lines separate the different trading days. Notice that the pivot levels of every trading day are lined differently. This is so, because each trading day has different daily high, low and close values. In this manner, the pivot levels are different too. This is why there is a rapid switch in the levels of the pivot lines for every trading day.
Trading Pivot Points
There are few basic rules when trading pivot points.
- Be bearish when the price is below the main pivot point.
- Be bullish when the price is above the main pivot point.
- Go long if the price bounces from S1, S2, or S3.
- Go short if the price bounces from R1, R2, or R3.
Since we have discussed the structure of the pivot points and the way they are calculated, it is now time to demonstrate pivot trading using some chart examples. Have a look at the image below:

This is the hourly chart of the USD/JPY for Feb 29 – Mar 4, 2016. The chart shows the pivot points’ price action for 5 consecutive days.
The circles show moments when the price consolidates and hesitates in the area of a pivot point. The arrows show moments when the price finds support or resistance around a pivot point level.
In this example we see price hesitate around a level 4 times and in 8 instances we have a price reversal after interaction with a pivot point.
Pivot Trading Strategy
Now that we have seen pivot points in action, we will now turn to applying some pivot point trading strategies.
Trading Pivot Points with Price Action
Firstly, I will show you how to use pivot points as a part of a pure price action trading strategy, without the assistance of any additional trading indicator. We will rely on regular breakout rules to enter the market. If we enter the market on a breakout, we will put a stop loss below the previous pivot point. We will target the second pivot point level after the breakout.
Take a look at this chart:
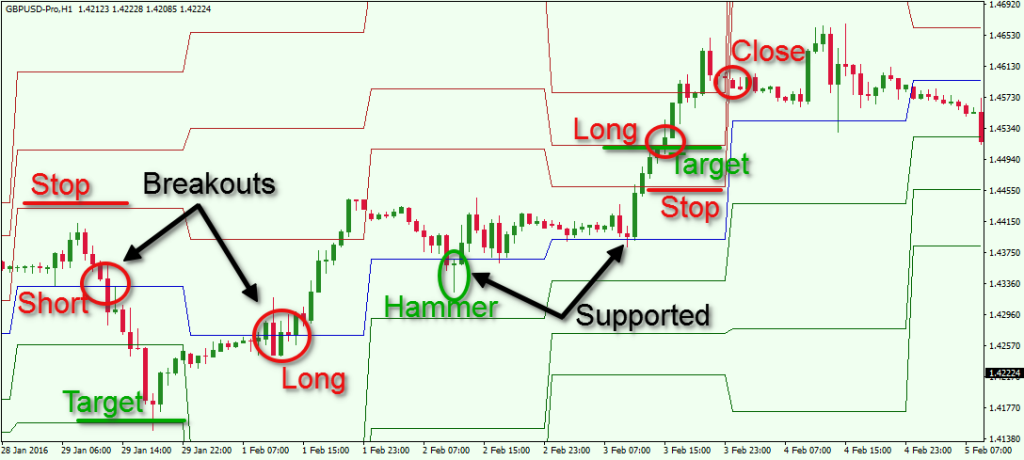
This is the H1 chart of the GBP/USD for Jan 28 – Feb 5, 2016. There are two breakouts through the PP level, which could be traded.
The first breakout through the blue pivot line comes in the beginning of the chart. One could short the GBP/USD. A stop loss order should be put right above R1 – the first pivot level above the main pivot point. The target should be S2 – the second level below the main pivot point.
It is very important to emphasize, that if your trade is held overnight, then the pivot points will likely change for the next day. In this manner, your stop loss and target may need to be adjusted to reflect the new levels.
As per the trade example above, about six hours after the short trade in the GBP/USD Forex pair, the price reaches the target, which was about a 138 pips profit potential.
The price starts increasing after reaching the target. In the middle of the next trading day, the GBP/USD breaks the main pivot point in bullish direction. This is a good long position opportunity. If you want to take this long opportunity, you should place your stop loss order right below S1, which is not visible on the picture in this particular moment. At the same time, your target should be on R2.
After breaking the main pivot point the price starts increasing and it breaks through R1. On the next day, the pivot levels are different. The price decreases to the central pivot point and it even closes a candle below.
However, the candle is a bullish hammer, which is a rejection candle formation. This hints that the trade should stay open. Furthermore, the stop loss below S1 is still untouched. The price then starts a consolidation which lasts until the end of the trading day.
When the next trading day comes, the pivot points are readjusted again and they are tighter. The main pivot point is higher. The price tests the main pivot point as a support again and bounces upwards. Then the GBP/USD enters an uptrend and the target at R2 is reached.
Notice that after reaching the target, the GBP/USD closes a candle above R2. This implies that the uptrend might continue, which puts on the table a third trading opportunity. If you go long here, you should place a stop right below R1. Since the trade is long and it is open on a breakout through R2, the target limit order should be placed somewhere above R3 (we have no R4 level). You could also use your own price action rules to determine how long you should stay in the trade.
Trading Pivot Points with MACD
In this pivot trading strategy I will include the Moving Average Convergence Divergence (MACD) indicator. The point of this strategy is to match a pivot point breakout or bounce with a MACD crossover or divergence. When you match signals from both indicators, you should enter the market in the respective direction. A stop loss should be used in this trading strategy the same way as with the previous strategy. Your stop should be located on the previous pivot level. You should stay in the trade until the MACD provides an opposite crossover. The image below will make the picture clearer for you.
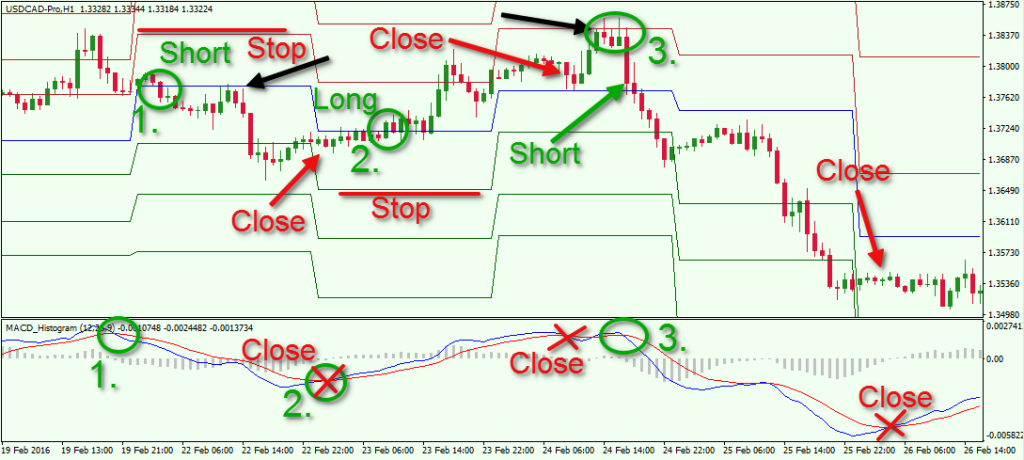
This is the H1 chart of the USD/CAD for Feb 19 – 26, 2016. The image shows one long and two short position opportunities. Signals are based on pivot point breakouts and MACD crosses.
We start with the first trading opportunity which is short. MACD lines cross downward and we get the first signal for an eventual downtrend. Few hours later we see the price breaking through the main pivot point, which is the second bearish signal in this case. One can now short the USD/CAD based on this trading strategy. A stop loss should be put right above the R1 pivot point as shown on the image.
The price starts a downward movement. However, we see a correction to the main pivot point (first black arrow). The price then bounces from the PP level and the decrease continues. The second hesitation in the bearish trend leads to a bullish cross of the MACD lines and the trade should be closed. One could have made 53 pips from this trade.
Notice that few hours after the bullish MACD cross, the price switches above the main pivot point. There are two matching signals coming from the PP and the MACD. This looks like a good long opportunity which could be traded. In this case the stop loss should be located right below the S1 pivot point. The price starts increasing and the MACD starts trending in a bullish direction. In the middle of the next trading day the MACD lines interact in the bearish direction. This should be taken as a closing signal. The long trade would have generated profit of 57 pips.
The price increases to R1 and starts approaching this resistance level. Suddenly, the USD/CAD bounces in a bearish direction. At the same time, the MACD lines cross in bearish direction as well. This is another match of two signals from the pivot points and the MACD, which is a short position opportunity.
The price immediately switches below the PP level and keeps decreasing rapidly. A correction occurs afterwards and the MACD lines almost cross in bullish direction. However, there is no bullish reading coming from the MACD and the trade should be held. The prices continues to move downward. The next hesitation in the bearish trend leads to a bullish cross in the MACD, which should be taken as an exit signal. This trade would have generated profit of 235 pips in about two days.
Conclusion
- Pivot points are important intraday chart levels, which act as support and resistance areas.
- Pivot points are considered very objective, since they are calculated using a precise formula.
- The basic pivot point configuration include a basic pivot level (PP) with three resistance levels above (R1, R2, and R3), and three support levels below (S1, S2, and S3).
- Pivot points are calculated using the daily high, low and close of the Forex pair.
- In order to set daily time frames, many traders set the open-close of the Forex trading day to:
- Start: 00:00 AM GMT
- End: 11:59 PM GMT
- Every trading day the PP, R1, R2, R3, S1, S2, and S3 levels change their location, because the daily high, low and close are different every day.
- There are many pivot point calculators, which would facilitate significantly the way you extract your pivot data.
- There are ready to use pivot indicators, which adapt to your trading platform.
- You should always use a stop loss order when you trade pivot points. A good place to put your stop at is the previous pivot level from the one you use to enter the market.
- You should take profit after the price goes through two pivot areas, or based on other price action clues or a confirming indicator signal.
- Two methods for trading pivot points are:
- Trading Pivot Points using Price Action
- Trading Pivot Points with MACD