Well, this is cool: Astronomers at the Ruhr-Universität Bochum in Germany have created a ridiculously huge 46 billion pixel map of the sky! According to the press release, it’s the largest astronomical picture ever created in terms of pixel size (I have not heard of any larger, for what it’s worth).
Even better? It’s interactive. You can pan around, zoom in and out, and fiddle with the colors, too.
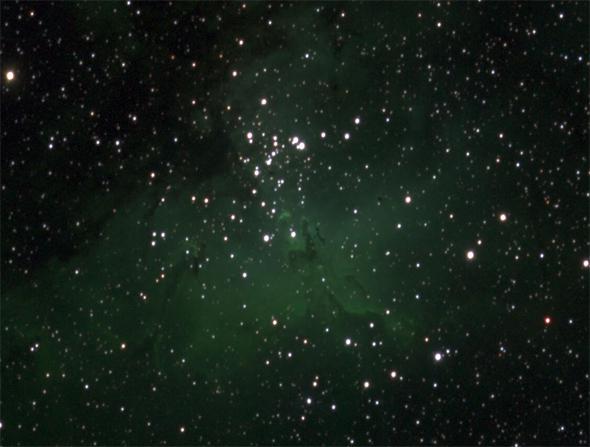
Here’s the link to the map. But, a couple of caveats. It’s not lightning-fast; I had to wait many times for it to load (I checked; my download speeds are around 20 Mbps). Also, without instructions it’s a little tricky to use, but if you play with it for a while you’ll get the hang of it. You can also type the name of an object into the finder box on the lower left; try “M 20” (the Trifid Nebula, screenshot shown below), “eta car” (for the bright star embedded in the Carina Nebula), or “M 16” (the Eagle Nebula, shown at the top of this post). By the way, nebulae appear green due to the filters they used to make the map.
The map isn’t of the whole sky; it’s actually a series of fields located along the plane of our Milky Way galaxy. Still, the numbers are impressive:
- Total number of fields making up the mosaic: 268
- Area of sky covered: 6° x 220° for a total of 1,323 square degrees (that’s more than 6,500 times the area of the full Moon on the sky!)
- Total file size: 194 Gigabytes
- Total number of stars: About 16 million
- Number of variable sources: 64,151
That last one was part of the reason why they did the survey. Here’s the scoop: The observations were made with a pair of small, 15 cm (6 inch) robotic telescopes located in Chile. Each ‘scope has a very wide 2.7° field of view, and they observe each of the 268 fields roughly once per month. They can detect stars down to about 18th magnitude, which is pretty faint: The dimmest star you can see with your naked eye is about 60,000 times brighter!
Many surveys go fainter, but then bright stars tend to blow those observations out. This survey was done specifically to reach middle brightness stars at high enough resolution to distinguish tightly spaced objects well.
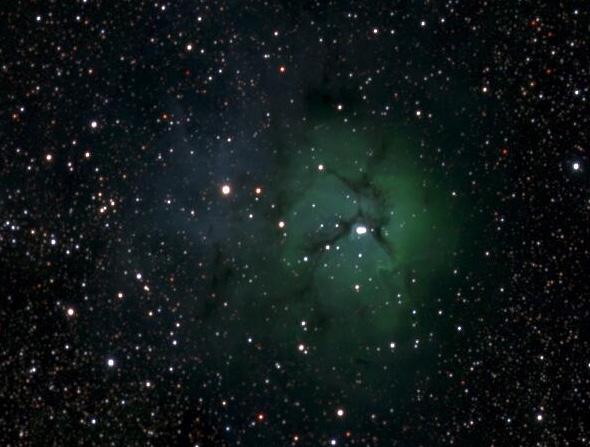
Photo by Haas et al.
By spreading out the observations over time, they can detect objects that change brightness. Some stars are variable, getting brighter and dimmer with time. Others are in binaries where one star blocks the other every orbit (called eclipsing binaries). Stars explode, asteroids fly by, and so on.
Analyzing this new dataset for his Ph.D. work, Moritz Hackstein found a total of 64,151 stars that changed their brightness, and nearly 57,000 of them were previously unknown! That’s pretty astonishing.
Surveys like this are precious and valuable. If an object changes catastrophically, we only get one chance to observe that event. This survey keeps a record of everything that happened in that section of the sky for nearly five years.
It’s also just fun to play with. I enjoyed scanning along its length, trying to see how many objects like nebulae I could identify. Only one big one stumped me (the Running Chicken Nebula, yes, seriously), but a couple of bright stars got past me, like Alpha Centauri.
It also gives you a sense of just how flippin’ huge the sky is. Zoom in, zoom out, pan around, but bear in mind: The total sky is about 40,000 square degrees. This map is therefore only about 3 percent of it.
There’s still a lot more to see.