LibreOffice: the numbers
The LibreOffice project keeps growing, and 2015 numbers have just confirmed this positive trend.
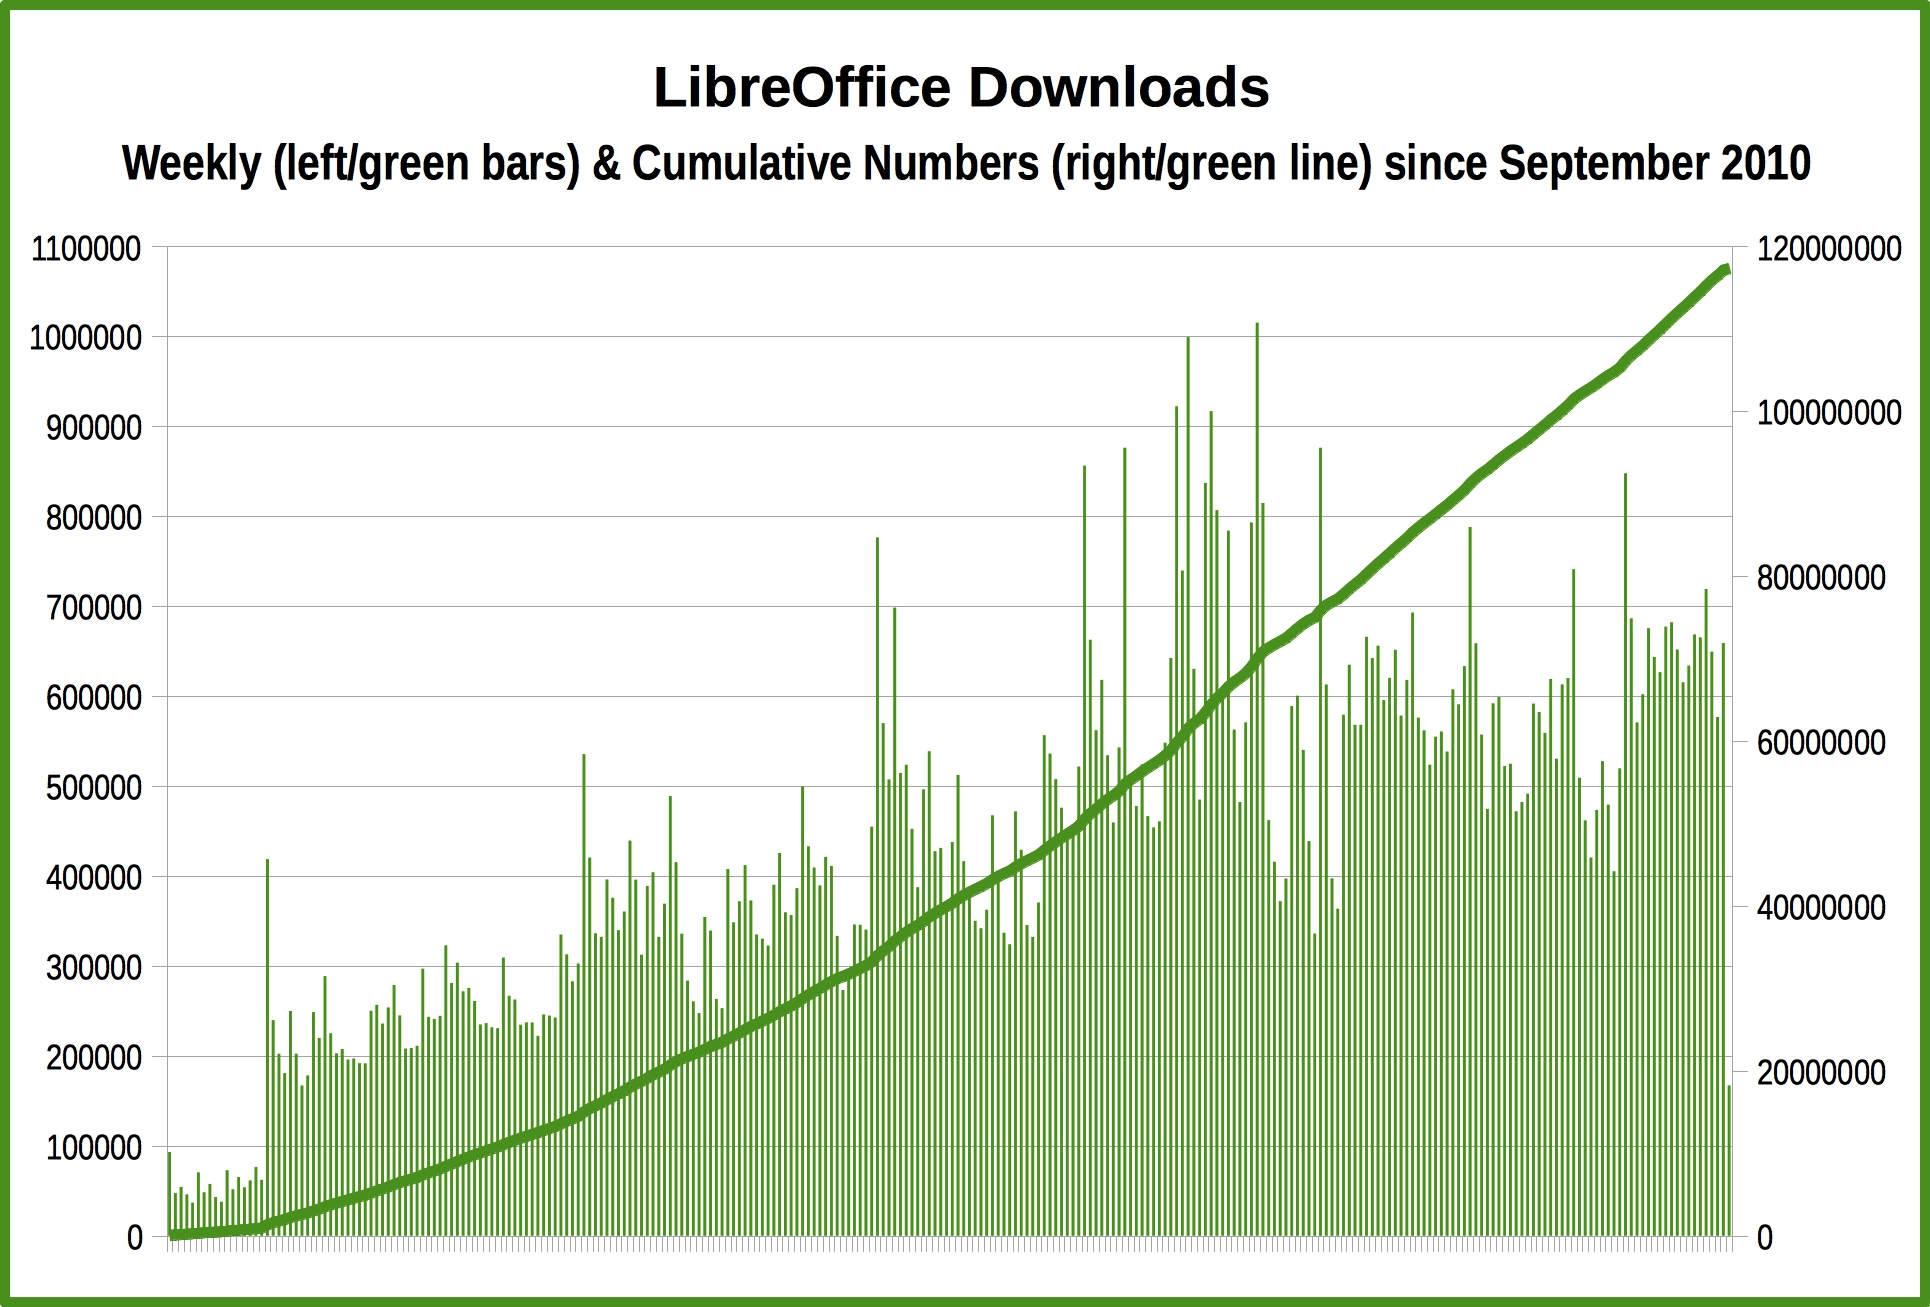
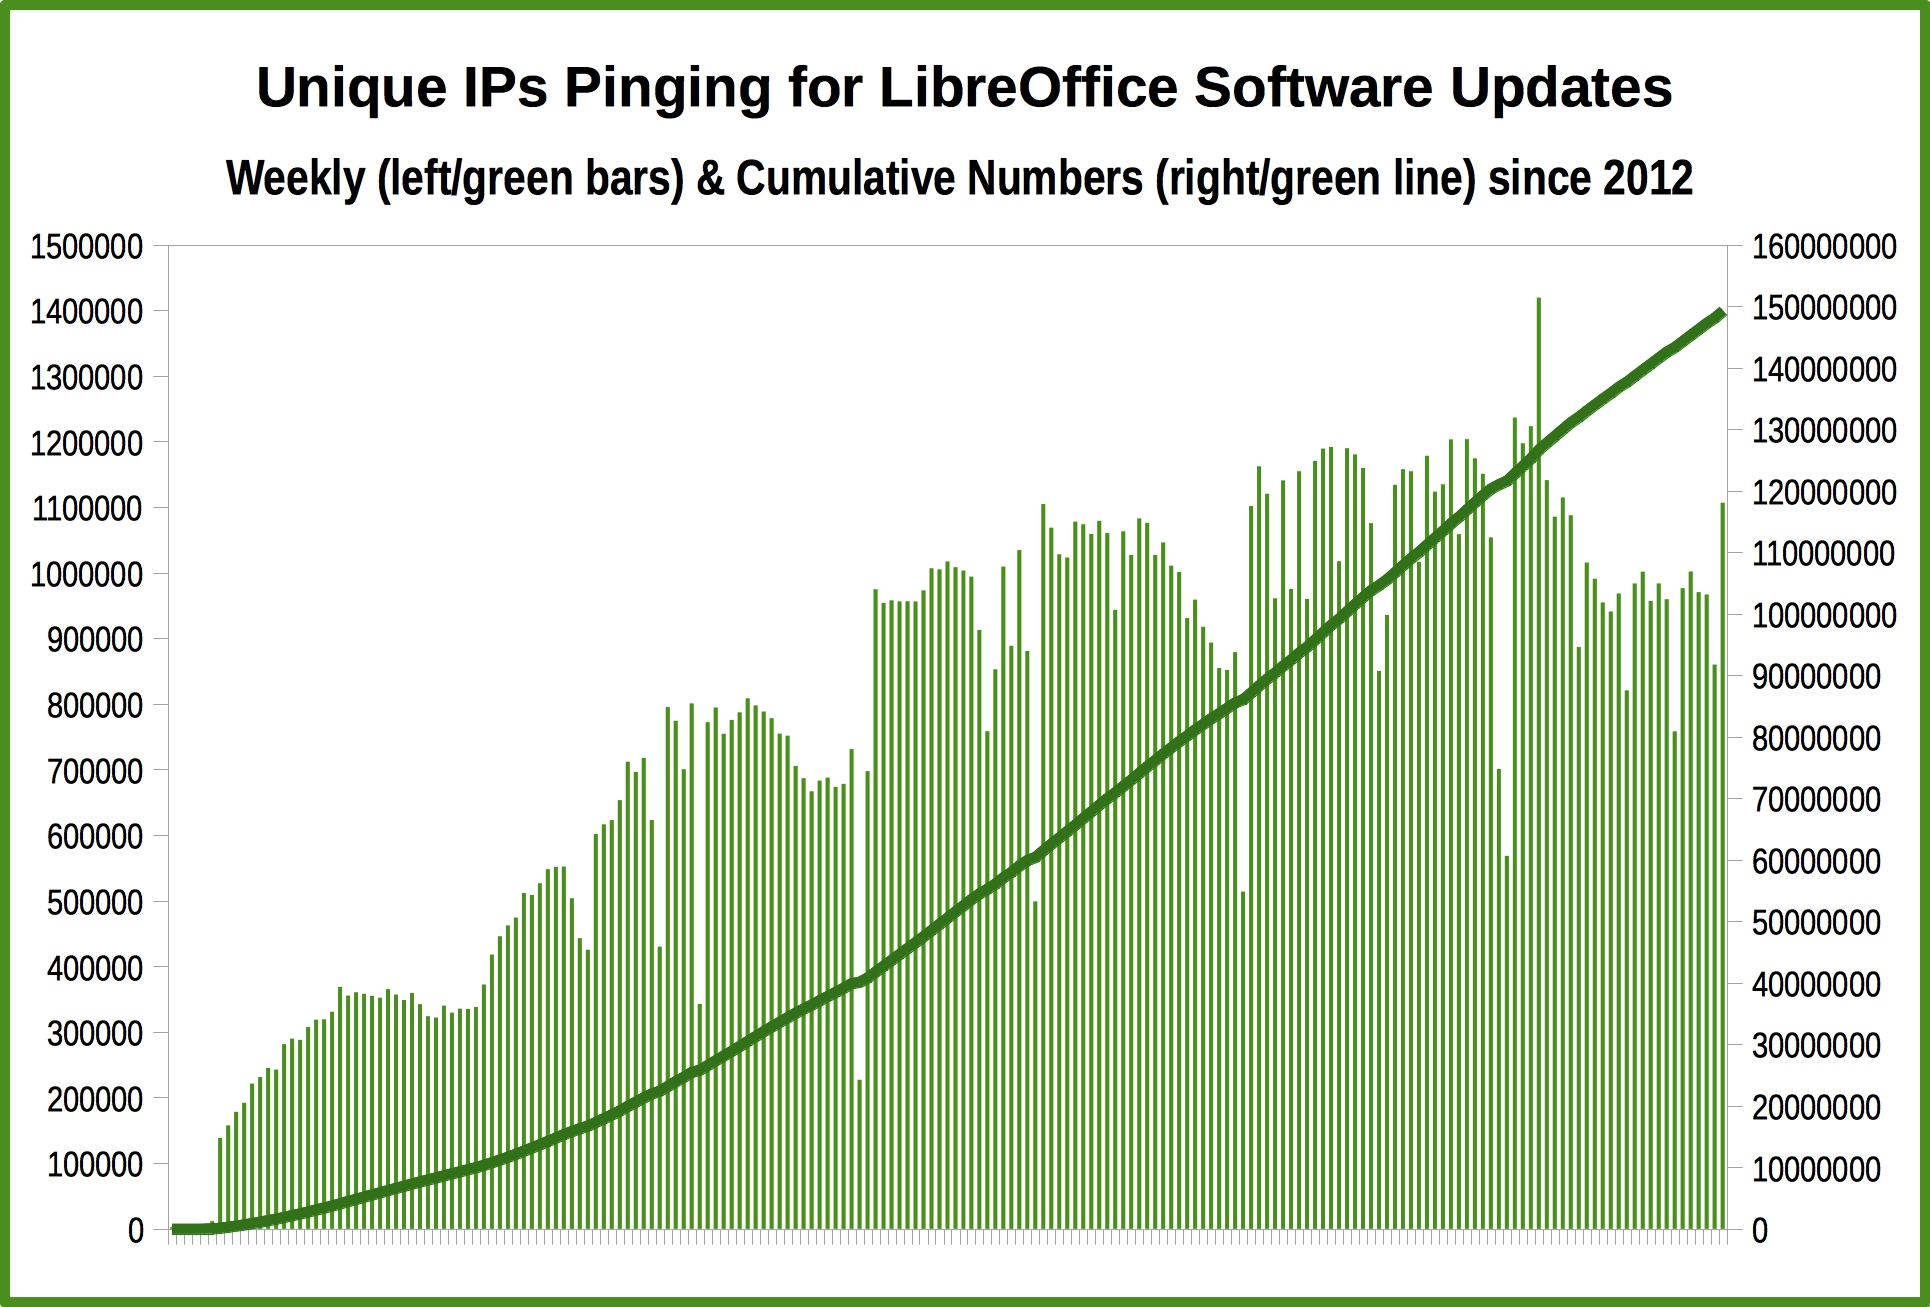 Downloads since September 2010 are close to 120 million, with a rather steady increase of weekly numbers. In 2013 there have been visible spikes after the launch of LibreOffice 4.0 and 4.1, as these versions were representing a significant growth in term of features over previous releases. Unique IPs pinging for updates are around 150 million since 2012 (when we have started counting them). Combined, the two charts provide a flavour of the growth of the installed base. Of course, all the usual caveats apply to the numbers, based on The Document Foundation own data.
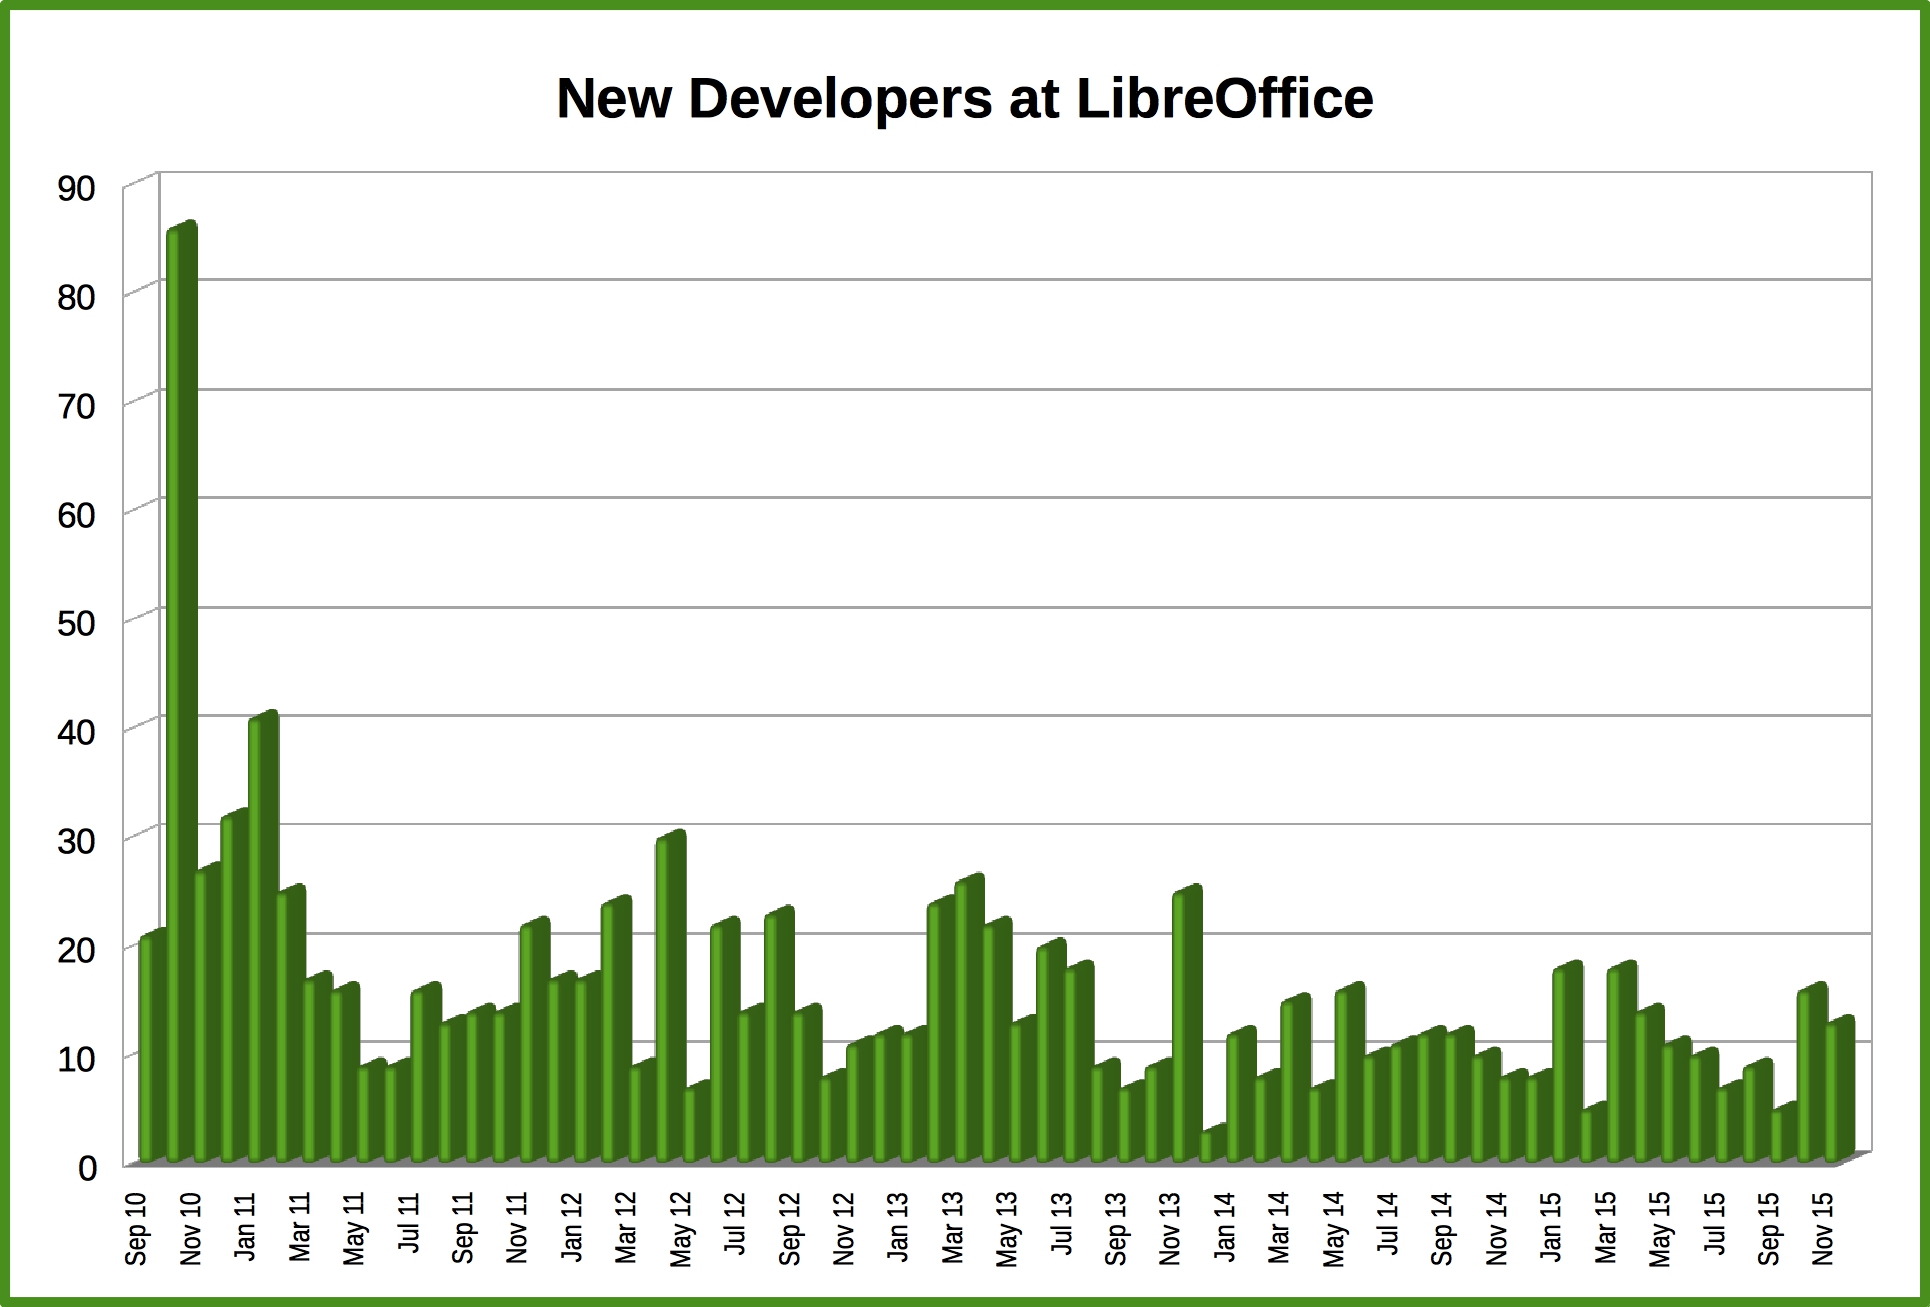
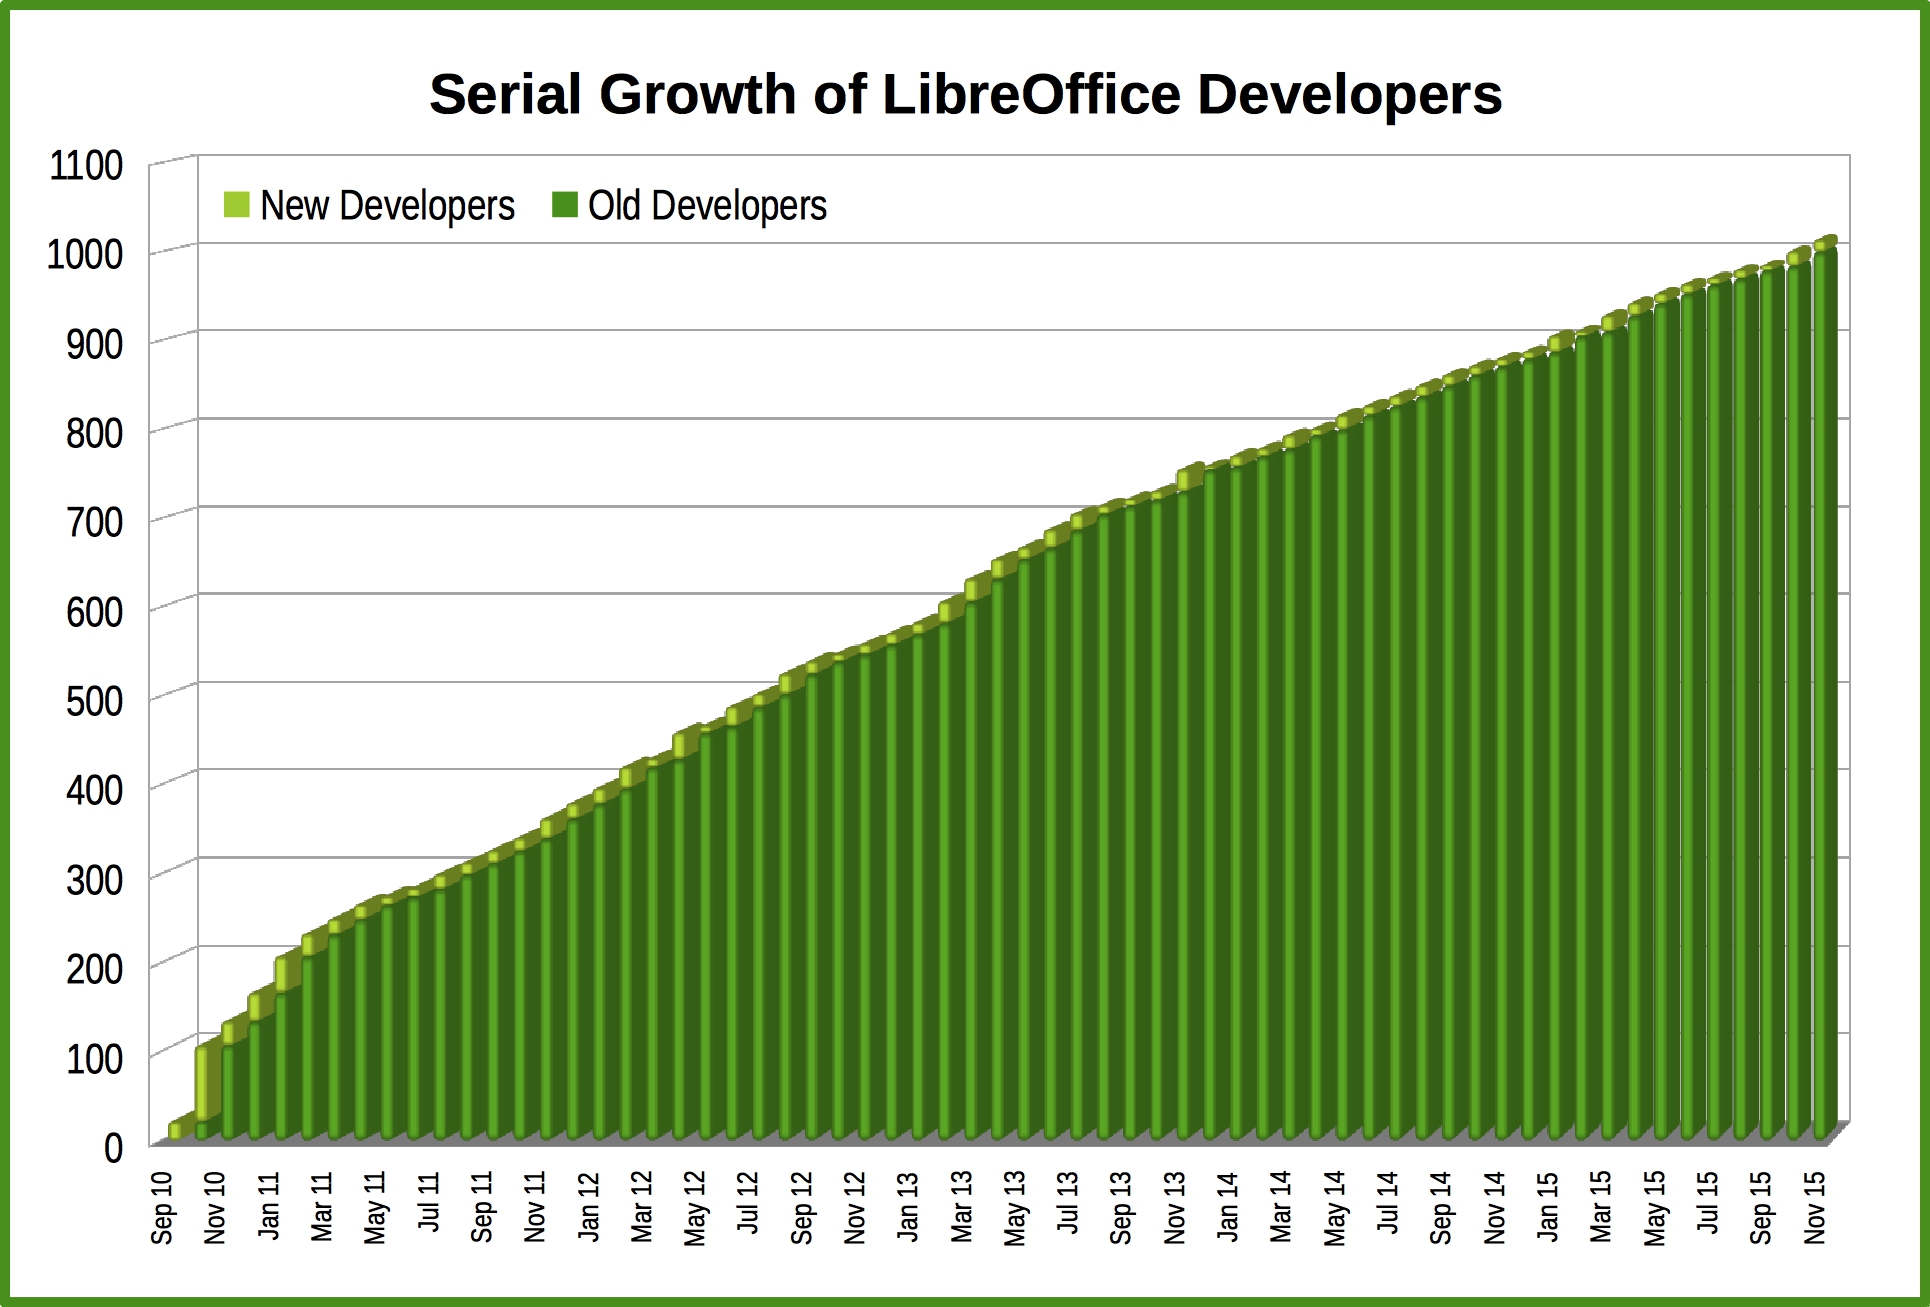 When LibreOffice has launched, one of the most important challenges was the growth of developers working on the source code (because it was considered extremely hard to approach, based on the OOo experience). The numbers after 60+ months show that the issue was represented by the approach and not by the complexity of the source code. In fact, Libreoffice has attracted at least 3 new developers per month since September 2010: a result which can be considered rather extraordinary in the free software environment. At the end of October 2015, this combined serial growth has reached the figure of 1,000 developers. Charts are based on OpenHub data, crunched – of course – with LibreOffice Calc.
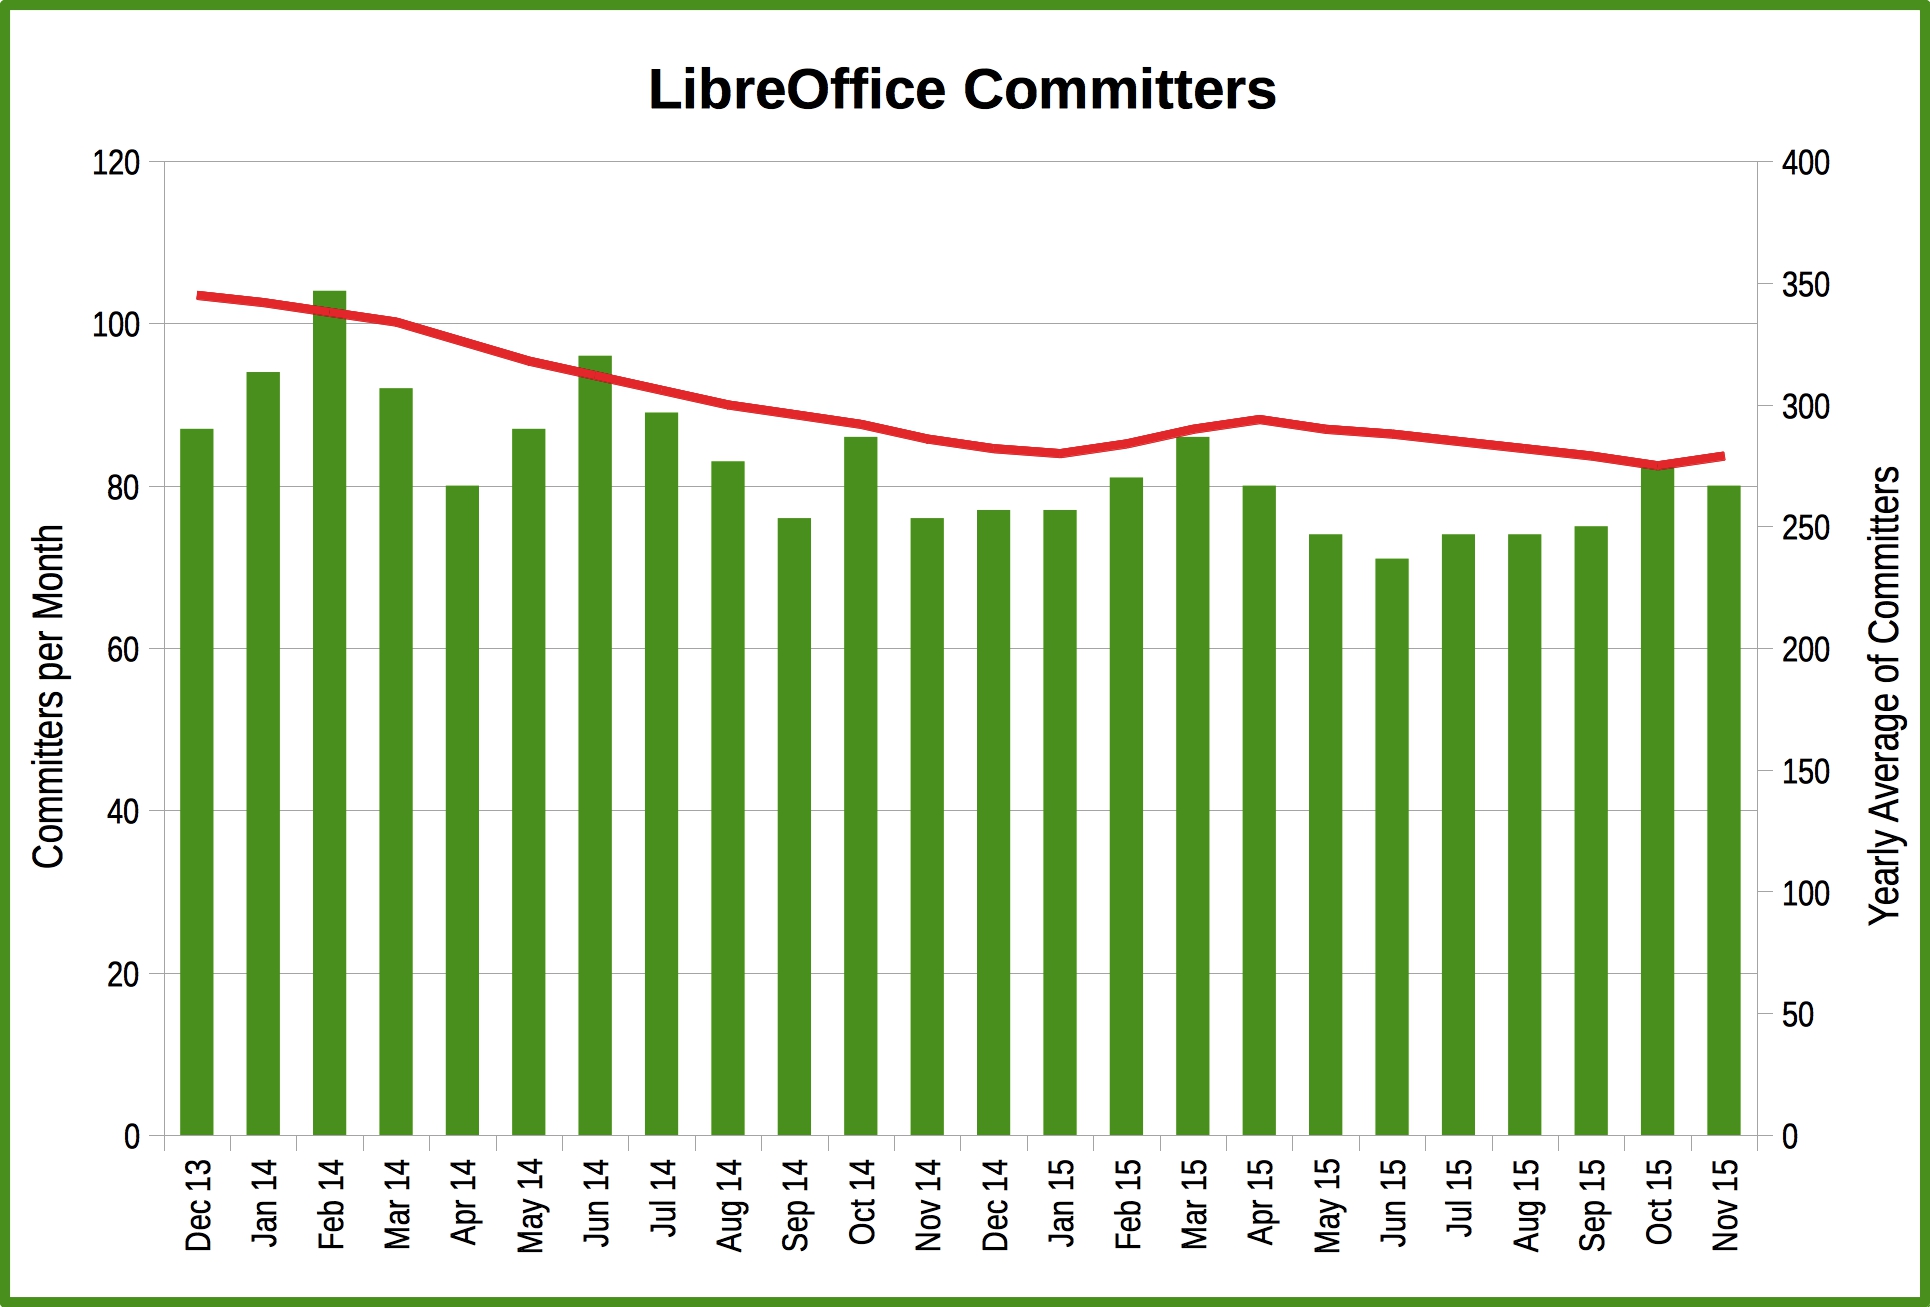
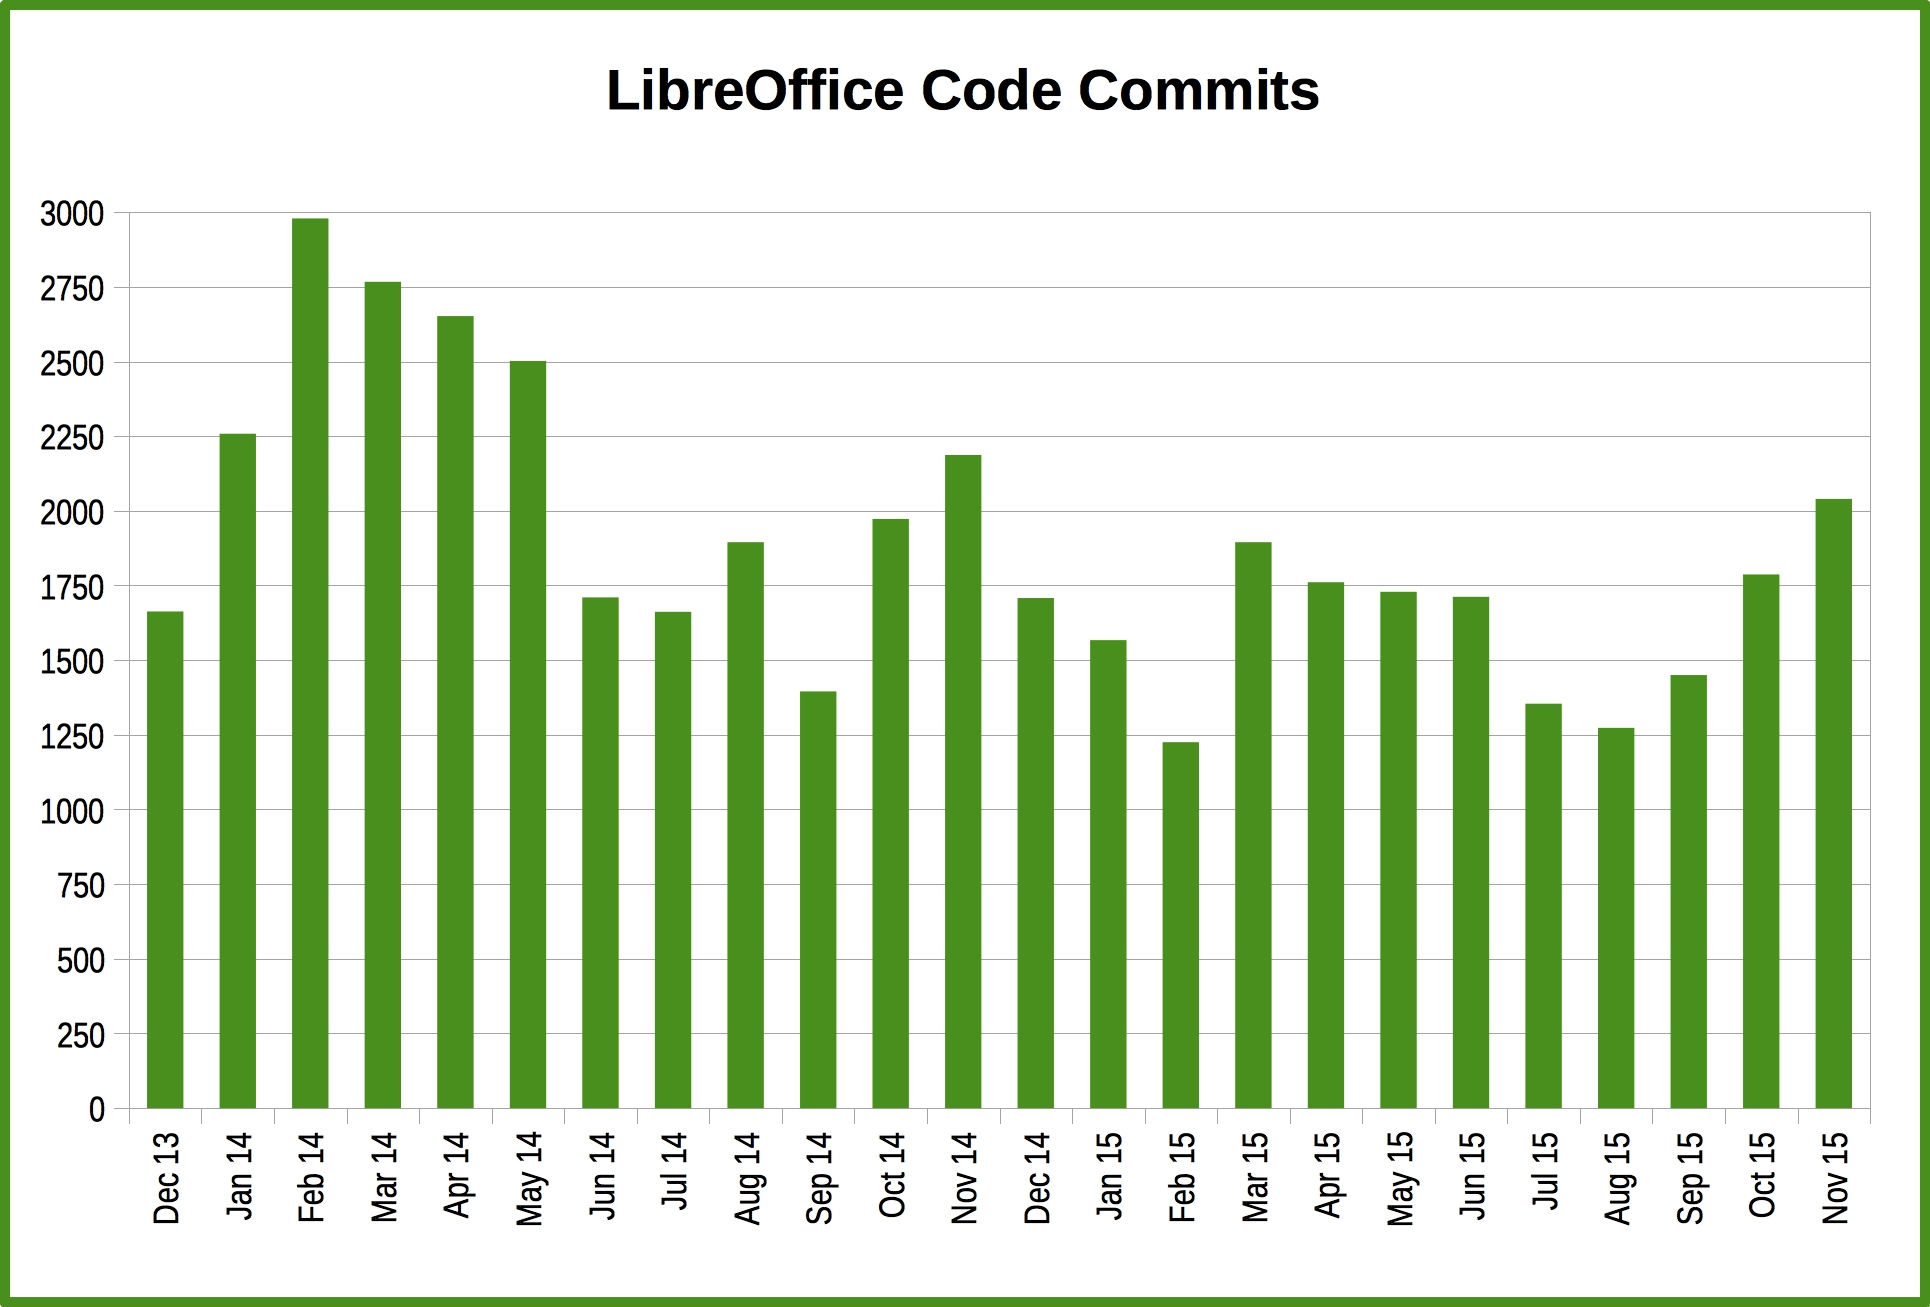 Of course, reaching 1,000 developers would be a meaningless achievement if the number of hackers contributing on a monthly basis were not enough to guarantee a continuity. These two charts show that over the last 24 months the number of developers contributing on a monthly basis has been around 80 (with a few small ups and downs), and the number of commits has always been higher than 1,250 per month (with peaks up to 3,000 in early 2014 and up to 2,000 on a regular basis). On a yearly basis, the number of active committers has slowly decreased from 350 to 275 (red line on the left chart, showing the yearly running average), but this is probably a consequence of the lower number of easy hacks which make the first step more challenging (an issue tackled with the hiring of a development mentor). Also these two charts are based on OpenHub data, crunched – of course – with LibreOffice Calc.
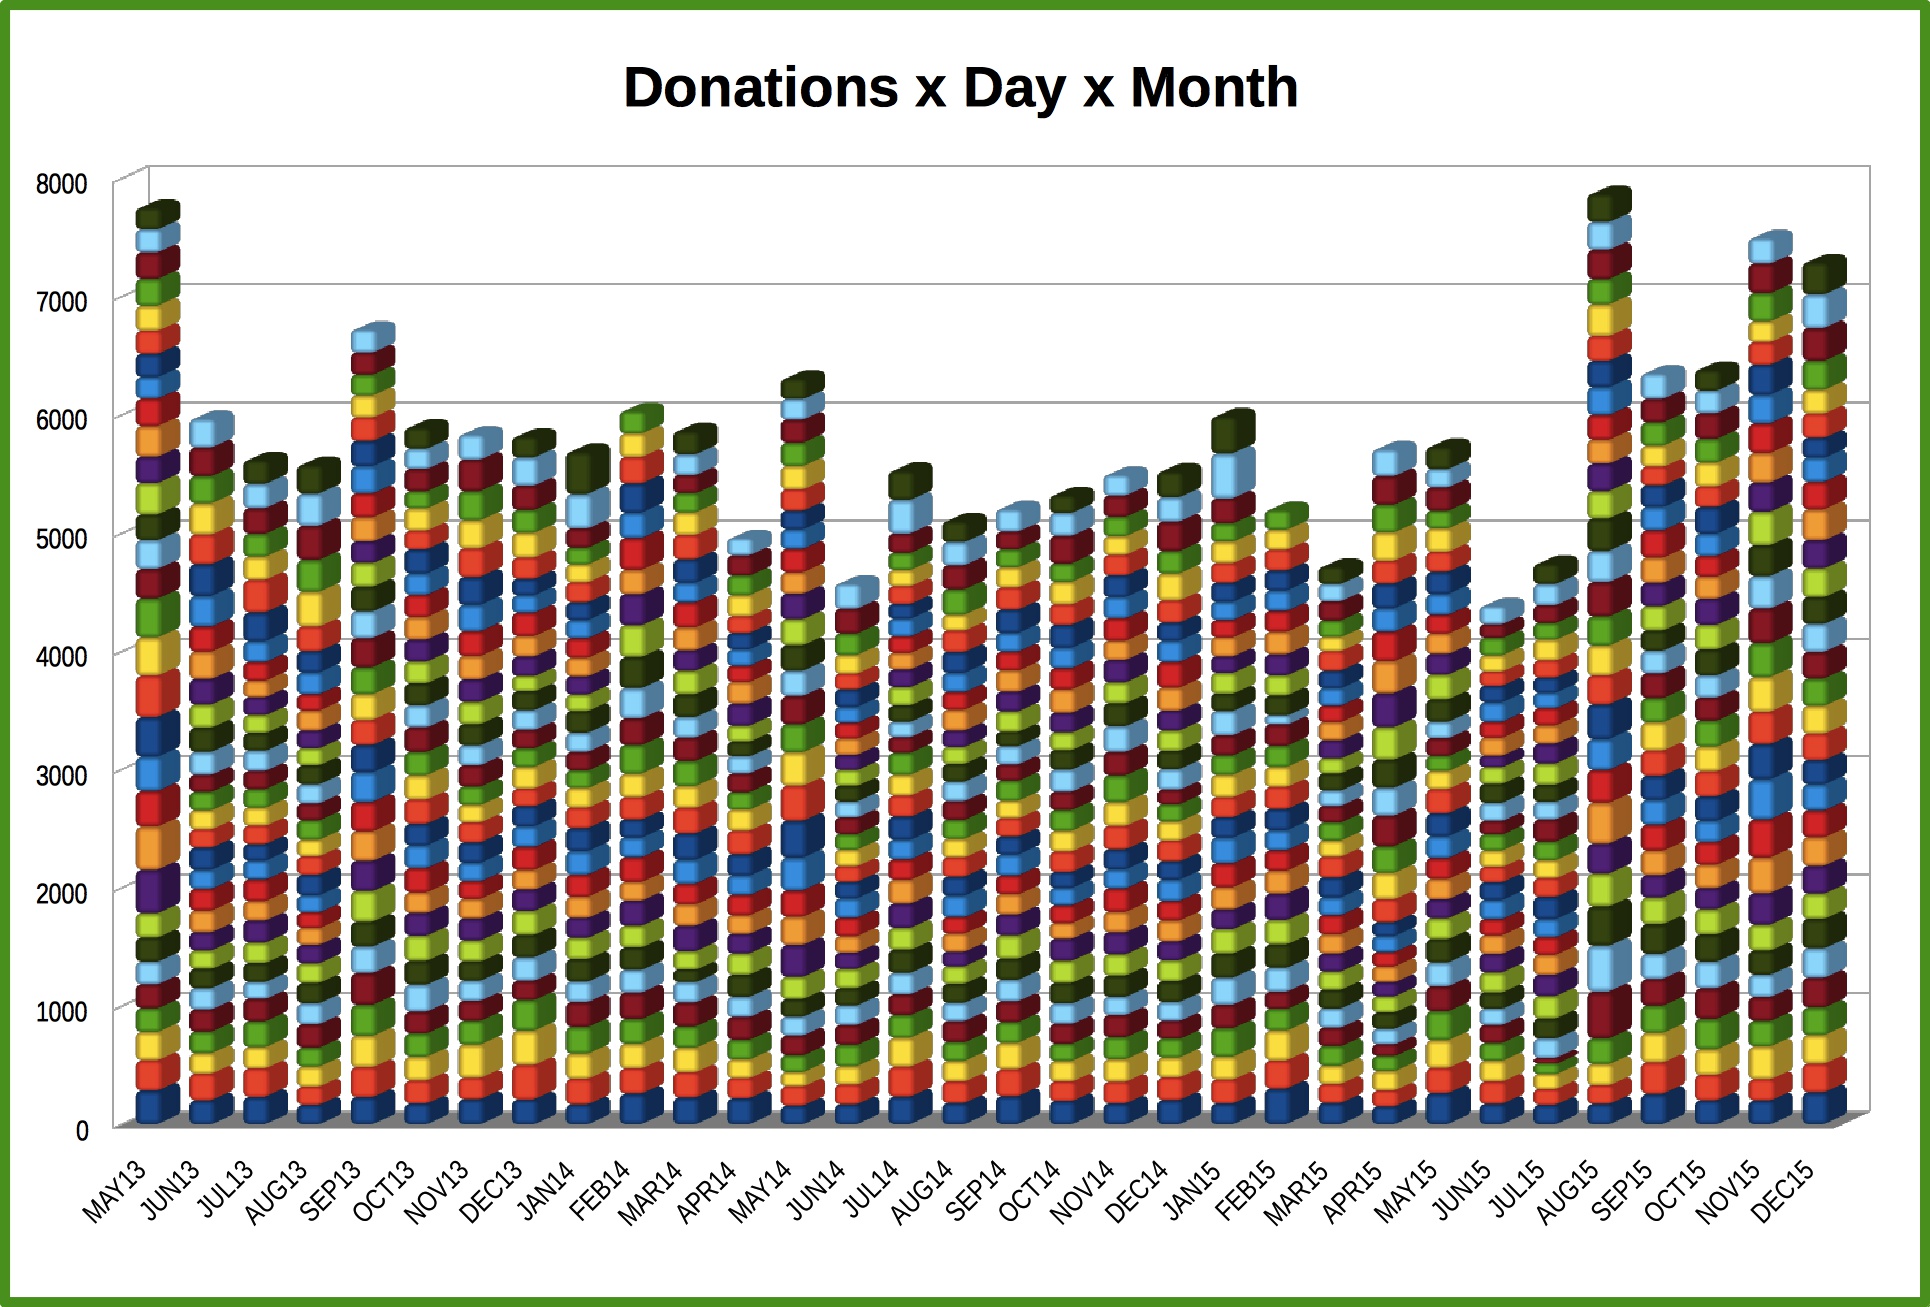
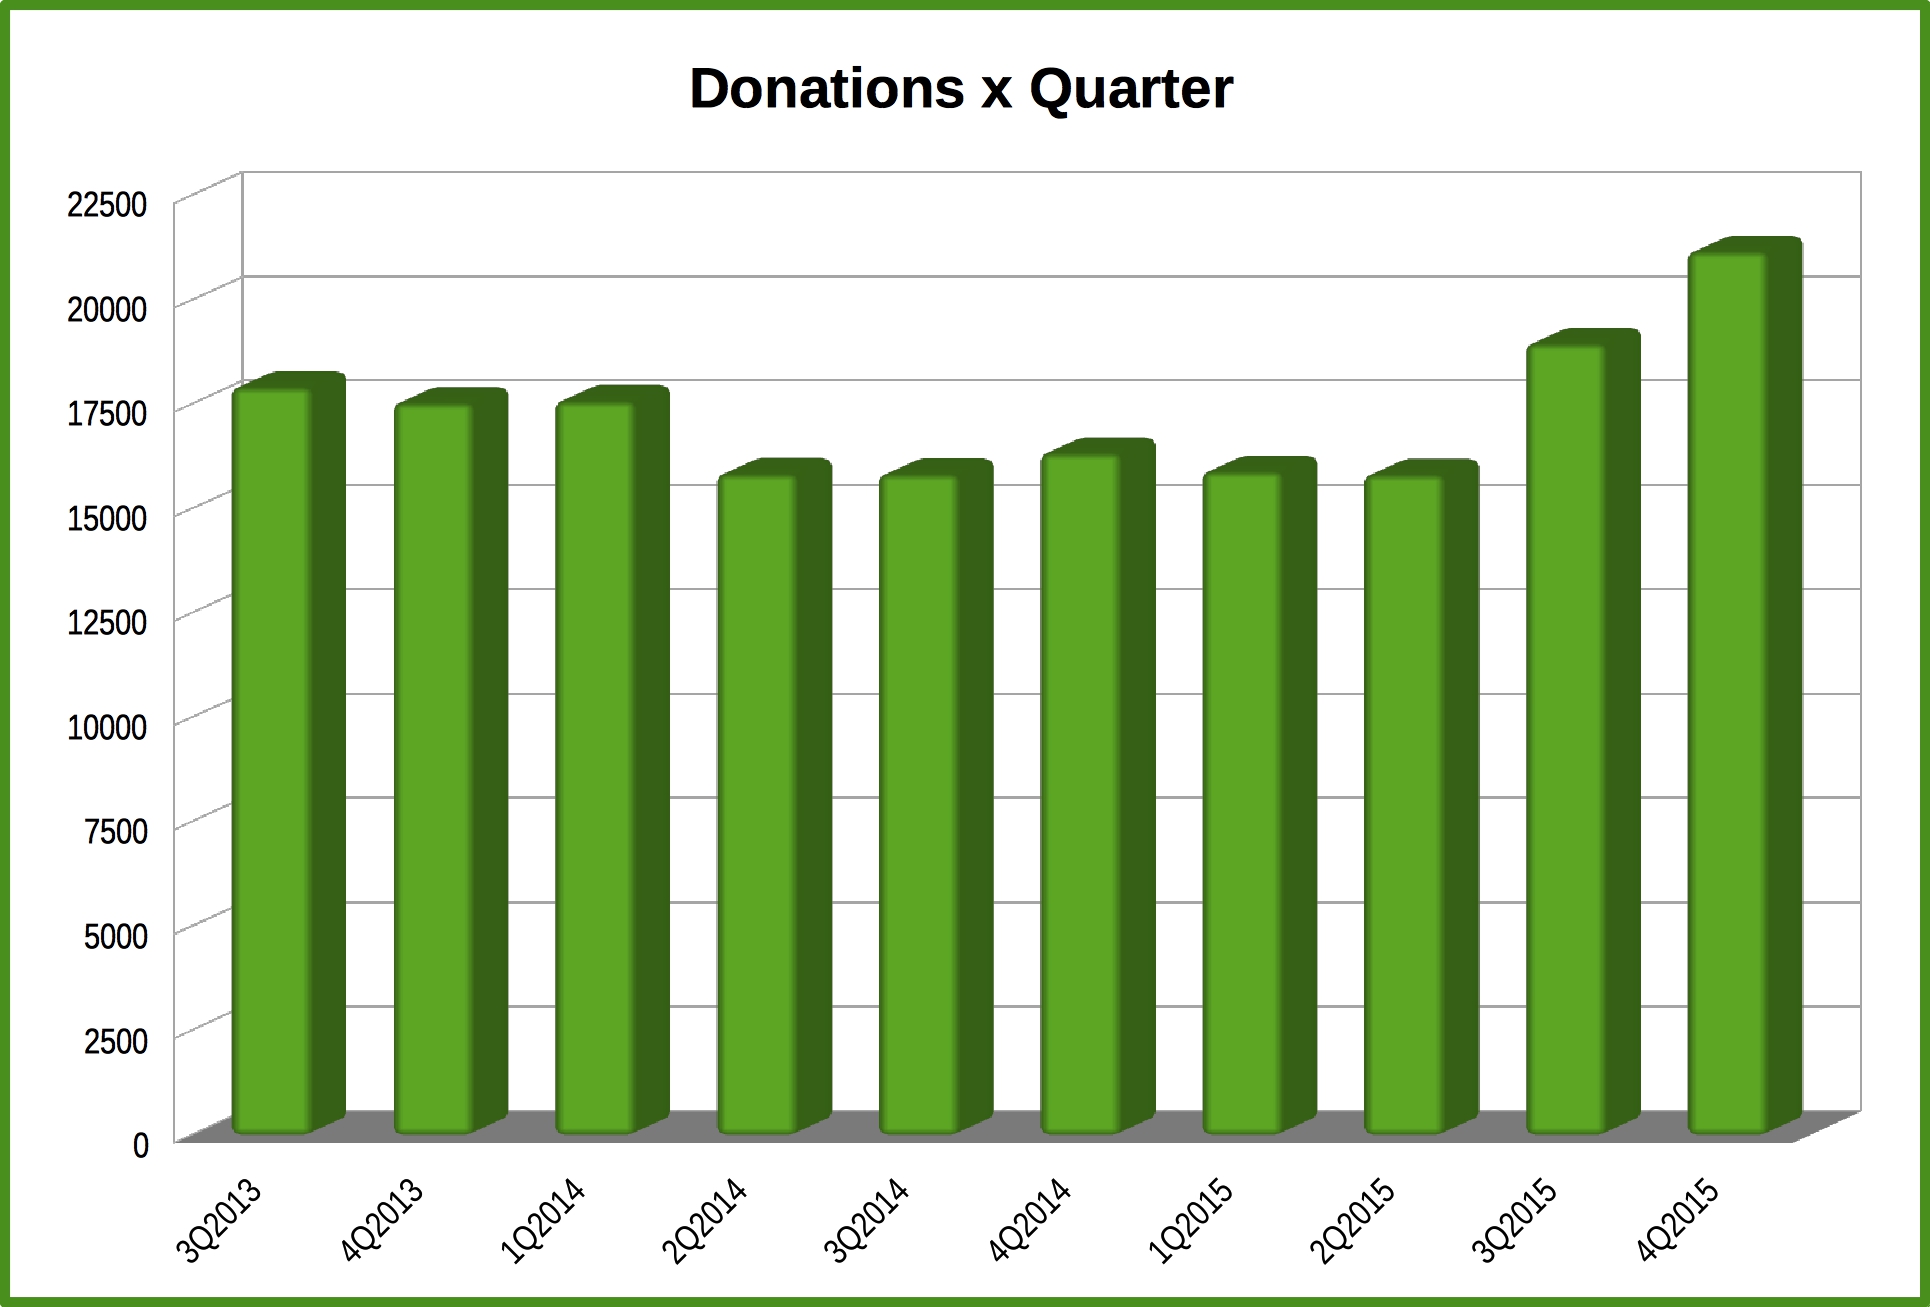 Another measurement of the LibreOffice success is based on donations. Most donations happen just after the download. Looking at the charts, it is rather clear that there has been a rather sharp increase in donations during the last two quarters (after the launch of LibreOffice 5.0 in early August 2015). Of course, these numbers do not represent the user attitude about LibreOffice (as we do not know anything about the demographics of the people who have donated), but the trend is encouraging.
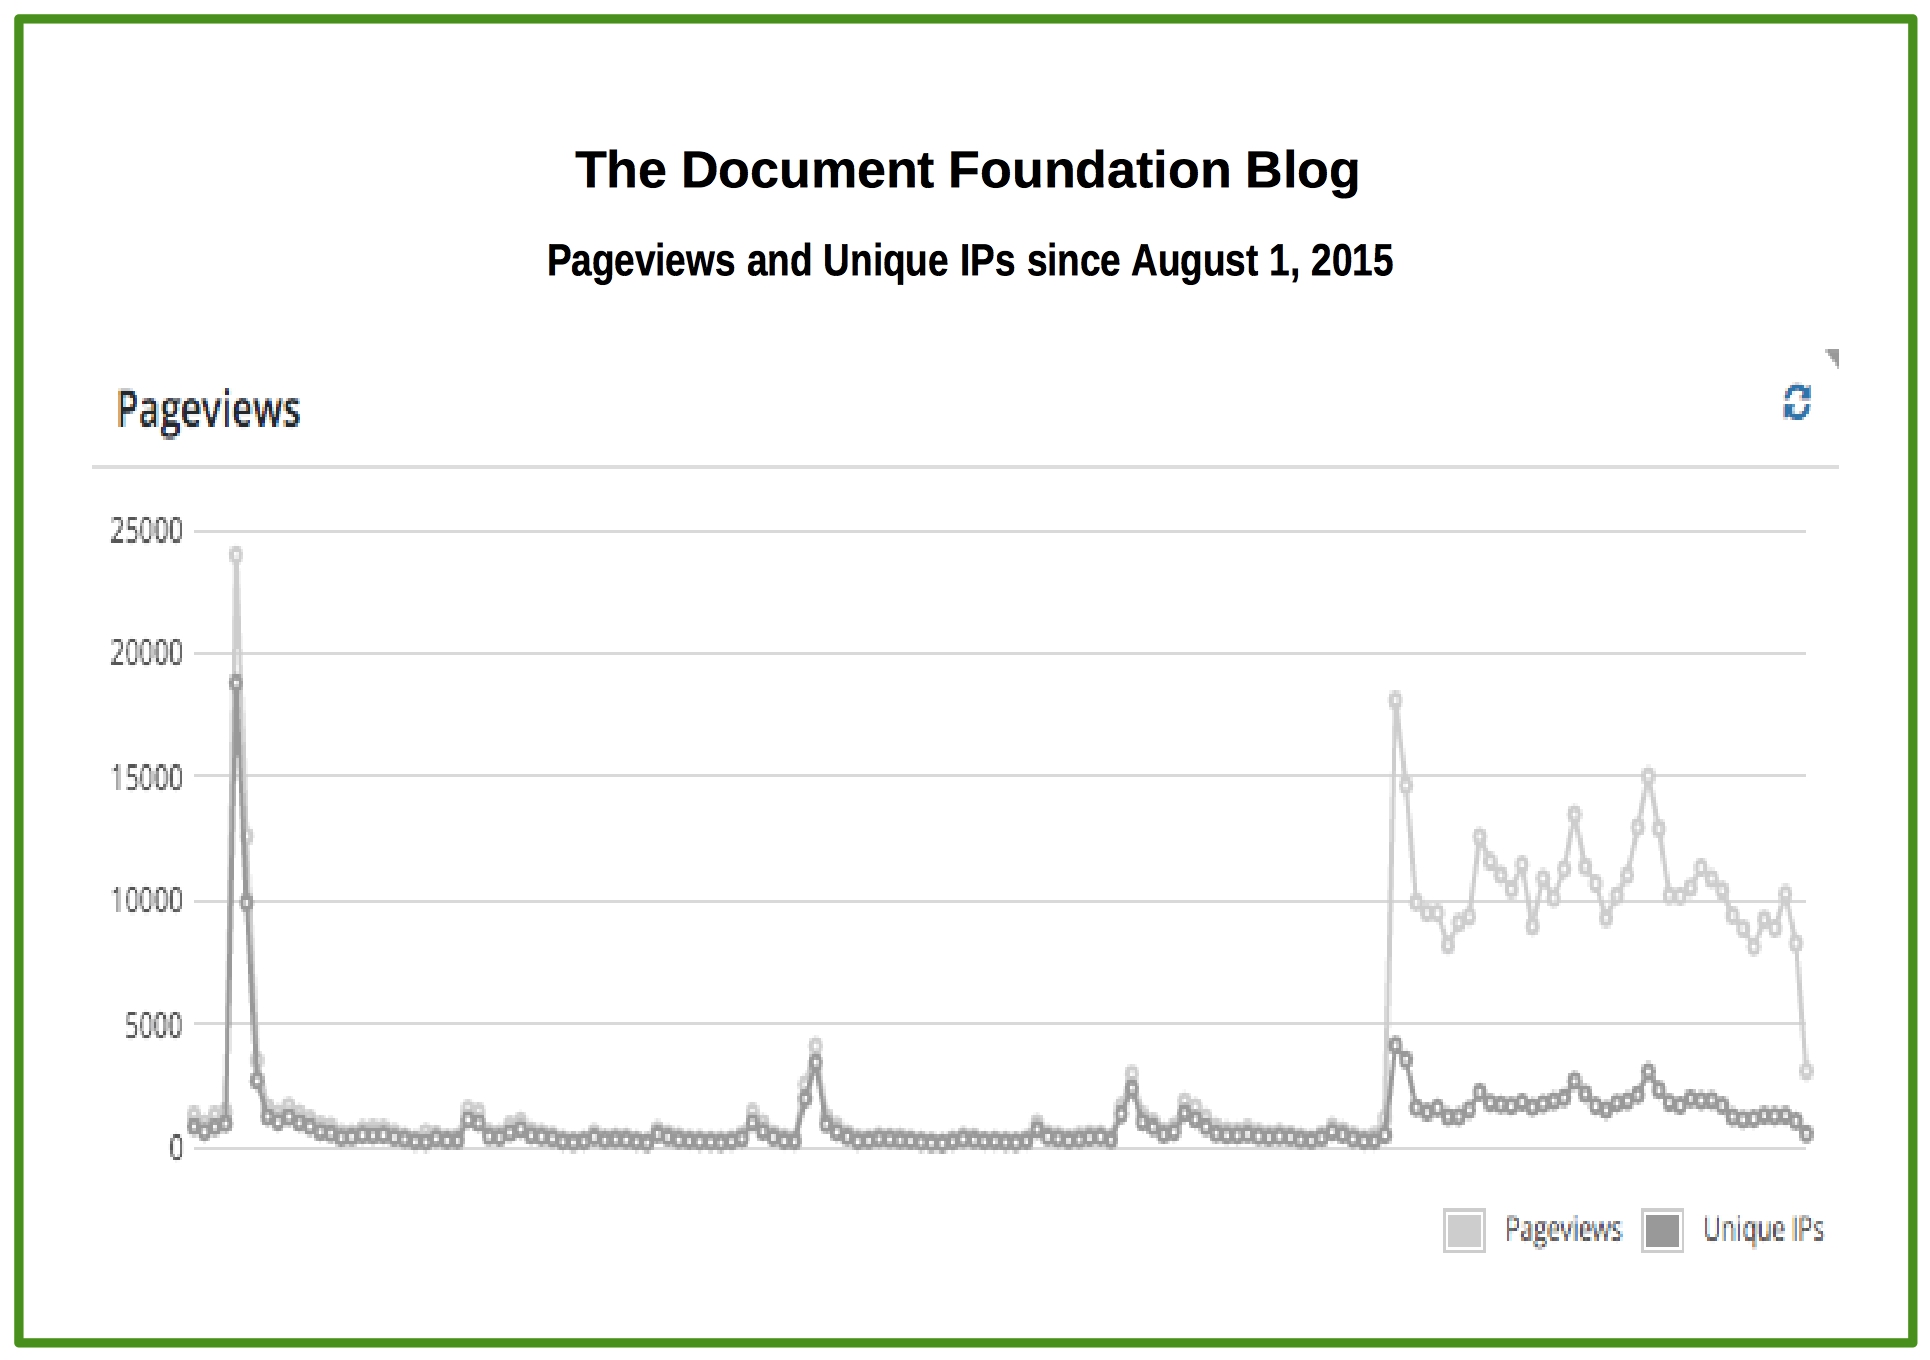 The last chart shows Pageviews and Unique IPs from The Document Foundation blog, over the same timeframe (from August 1st to December 31, 2015). It is rather clear that there has been a spike for the launch of LibreOffice 5.0, and then – after almost three months of flat numbers – there has been a sharp increase in Pageviews starting from November (the same timeframe of the increase in donations of the last two months). Another encouraging trend.
[high resolution charts can be opened by double clicking on the thumbnail]
No Responses