8 charts and maps show why drought will be a growing challenge in the U.S.
- Writing byTodd Reubold
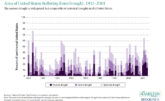
The current drought facing much of the American West is extreme, but is it unusual? According to the report In Times of Drought: Nine Economic Facts about Water in the United States, “Droughts covering 40 percent or more of the country have occurred once in at least eight of the past nine decades.” We may need several more years, or decades, to determine if the current drought reaches truly historic proportions in terms of its impact and duration.
Image from The Hamilton Project report titled In Times of Drought: Nine Economic Facts about Water in the United States.
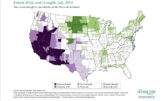
This map from 2014 reveals the extent of the drought stretching from the Pacific Coast all the way to Texas. A more recent map from the United States Drought Monitor website shows precipitation has returned conditions to normal in Texas, Colorado and eastern New Mexico, but extreme to exceptional conditions remain in California and Nevada and are spreading to Montana and the Pacific Northwest.
Image from The Hamilton Project report titled In Times of Drought: Nine Economic Facts about Water in the United States.
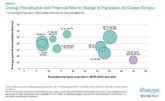
It’s no surprise America’s population is expected to grow in the South and the West. What this means, though, is in coming decades more and more people will live in some of the driest states in the country, exacerbating already pressing water scarcity concerns.
Image from The Hamilton Project report titled In Times of Drought: Nine Economic Facts about Water in the United States.
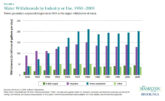
Water conservation efforts often focus on reducing consumer demand at home, but power supply and irrigation are by far the biggest users across the country — combining for 80 percent of all water withdrawals in the U.S. There’s an important distinction between the two, though. Most of water used for power generation is returned directly to the source, whereas a far higher percentage of water for irrigation is “consumed” or not returned directly to where it came from.
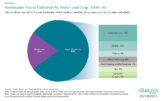
Image from The Hamilton Project report titled In Times of Drought: Nine Economic Facts about Water in the United States.
As journalist Sena Christian previously wrote in Ensia, water scarcity and access rights are particularly challenging in California, the country’s leading agricultural exporter. Eighty percent of the state’s freshwater withdrawals are for agricultural purposes, with 14 percent used to grow alfalfa that’s often exported overseas to feed cattle.
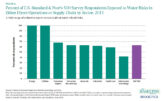
Image from The Hamilton Project report titled In Times of Drought: Nine Economic Facts about Water in the United States.
It’s not just agriculture that depends on water, though. A wide-range of businesses and industries are exposed to water risks across their supply chains. And according to a 2013 report from CDP, most of these companies are underprepared for the risk that water uncertainty will bring in the future.
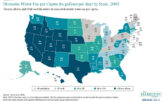
Image from The Hamilton Project report titled In Times of Drought: Nine Economic Facts about Water in the United States.
A number of the driest states in the American West have the highest rates of water consumption in the country — with Nevada topping the list at 190 gallons per day per capita. By comparison Maine is at the bottom of the list with 54 gallons. What’s driving the higher numbers across the West? Outdoor watering of thirsty lawns and gardens in states with drier climates.
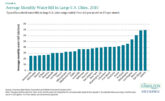
Image from The Hamilton Project report titled In Times of Drought: Nine Economic Facts about Water in the United States.
If we’re going to tackle the issue of water scarcity, then we have to talk about the price of water. Across the country bills for the same amount of water can range from around $20 to $70 per month with drought-prone cities falling at both ends of the spectrum. Some cities are using new pricing structures whereby higher consumption results in higher prices. With water resources under stress across the country, we’re quickly moving past the point where we can take access to clean, plentiful freshwater for granted.
Image from The Hamilton Project report titled In Times of Drought: Nine Economic Facts about Water in the United States.
The American West continues to struggle with an historic, years-long drought, with the latest area to be hit — the Pacific Northwest — garnering recent headlines. But is drought in the United States all that unusual?
A report from The Hamilton Project released in late 2014 examines the history of drought across the U.S. and the economics of water in the country.
As the report states, “Water supply is further challenged by increased climate variability, which directly impacts the reliability of water supply and calls into question the adequacy of our nation’s water infrastructure, much of which was designed to accommodate climatic projections that are increasingly obsolete.”
These eight charts and maps from the report illustrate how water scarcity is, and will continue to be, a growing concern across the U.S. as more and more people migrate west.
Charts, maps and data compiled by The Hamilton Project, an economic policy initiative at the Brookings Institution, and presented in the report titled In Times of Drought: Nine Economic Facts about Water in the United States. Primary data sources listed on each individual chart and map.