If you’ve got Analytics, you’ve got insights waiting to be discovered. But are you finding these insights? Are you getting the most from your Analytics?
Are you using Google Analytics for real analysis? Or just reporting?
Most people use Analytics the wrong way. But this post will show you four ways to get real insights from your Analytics.
Most People Are Using Analytics Wrong
This is the wrong way to use Analytics:
-
Look at your favorite report, see if the line is going up or down
-
Smile or frown
-
Close Analytics and go back to your day
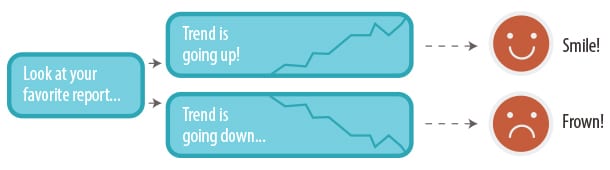
The problem with this approach is that it has no effect on your marketing. Nothing changes.
Now here is the right way to use Analytics:
-
Get a marketing idea
-
Ask a question that supports the idea
-
Find the report that provides the answer
-
Proceed with the idea (or reject it) based on the answer
-
Measure the impact
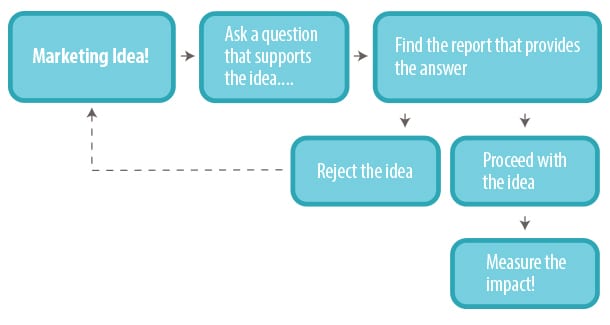
See the difference? Website Analytics is a decision support tool, not just a reporting tool. Ask questions and find answers. Form a hypothesis, test it and analyze the data.
Analytics is meant for analysis, not just reporting.
So let’s use Analytics to ask questions and find answers. Let’s form a hypothesis, challenge it with data, then make better decisions and do better marketing.
Ready? Let’s jump in!
Insights are everywhere
There are more than 100 reports in Analytics, some can be slightly inaccurate but we’re going to find insights from the four main types of reports. Look at the items at the bottom of the left-hand column.
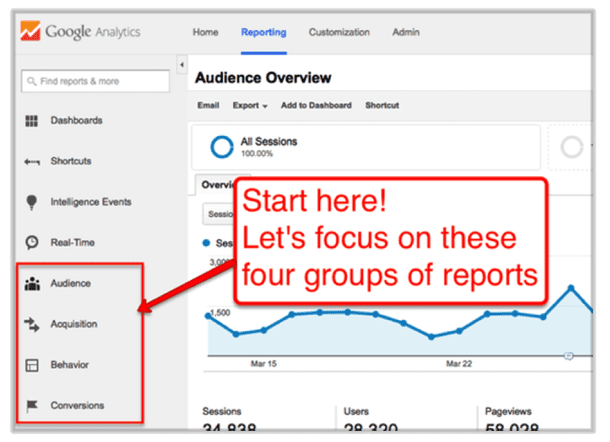
The main reports are organized into categories: Audience, Acquisition, Behavior and Conversions. Notice those first letters A, A, B, C. Google is trying to make this the ABCs of website data!
-
Audience
If you need information about who is visiting, it’s probably in here. -
Acquisition
If you’re wondering where people came from, the reports are in here. -
Behavior
Here you can learn what people are doing on your website, including information about what’s happening on your pages. -
Conversions
This sections tells you how many people are converting into leads, subscribers (and customers for ecommerce sites) and at what rates.
We’ll take an example of real analysis and make decisions that support our ideas from each of these sections.
Note: We’ll use the Orbit Google Analytics account here, but each answer and insight can be found in your own Analytics!
Insights from an Audience Report
For questions about who is visiting, answers can be found in the audience section.
Idea: Let’s build a tablet-friendly version of our website.
Our site looks great on phones and desktops, but we don’t have a version of it specifically for tablets. Maybe we should build a “full fluid” responsive website that would look great on all screen sizes; phones, desktops and tablets.
Question: What percentage of our visitors are using tablets?
Turn the idea into a question! Making the site fluid responsive will take time and money, so it’s important to understand what percentage of our visitors would be impacted and what that impact might be.
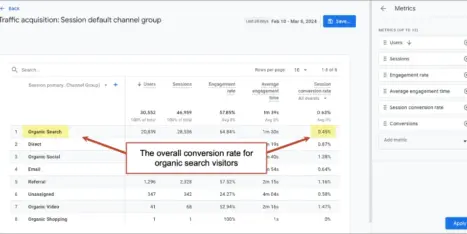
Answer: 3.8% of our visitors are using tablets.
Look in Audience > Mobile > Overview to see data about tablet visitors. This shows you what percentage of your visitors are using which type of device. It also shows how engaged they are and how likely they are to become leads and subscribers.
Analysis: Although the percentage of visitors using tablets is small, it’s growing. It’s not urgent, but eventually, we should have a tablet-friendly website.
Other questions you can answer using Audience reports…
-
What is the most popular path through your website (hint: User Flow)
-
What are the lifestyle preferences of your visitors (hint: Affinity Categories)
-
What percentage of your newsletter sign ups are from outside the US? (hint: Geo)
See if you can find the answers to these questions in your Analytics Audience reports!
Insights from an Acquisition Report
For questions about where people are coming from, answers can be found in the acquisition report section.
Idea: Let’s be more active in social media, so we can generate more traffic, subscribers and leads.
Our target audience is using social media networks. If we spend more time engaging with people on these social networks, we should be able to pull in more visitors. Those visitors may become subscribers or leads.
Question: Which social network is sending us the most visitors? Visitors from which social network are the most engaged?
Turn the idea into a question. It’s very time consuming to build an audience on a social network. Using the data we already have, let’s learn everything we can about visitors from social sources.
Answer: Twitter sends us the most traffic.
About 46% of social visitors come from Twitter, followed by Facebook, Google+ and LinkedIn. About 1.1% of visitors from social networks become subscribers or leads, which is on par with the site average.
The Acquisition > Social > Network Referrals report shows us how many visitors are coming from each social network and the basic levels of engagement: how long they’re staying (session duration) and how many pages they’re seeing (pages / session).
To see how likely these visitors are to become subscribers and leads, we need to look at Acquisition > All Traffic > Channels to see the engagement compared to other sources and we’ll look at Acquisition > All Traffic > Referrals and see the conversion rates for specific social networks.
Analysis: Social media brings in about 6% of all traffic.
These visitors seem to be about as engaged as visitors from other sources. But looking closer, we see that visitors from Facebook are twice as likely to subscribe to newsletters as visitors from Twitter. Visitors from social networks almost never become leads.
Other questions you can answer using acquisition reports…
-
What phrases are visitors using to find us in search engines? (hint: Queries)
-
Have any blogs mentioned us lately? Who’s linking to our content? (hint: Trackbacks)
-
Email newsletters are most effective on which day of the week? (hint: Campaigns)
See if you can find the answers in your Acquisition reports.
Insights from a Behavior Report
For questions about what people are doing on the site (including questions about which pages are performing well) answers can be found in the behavior reports.
Idea: Let’s change our website navigation!
Question: Which items in our website navigation are people engaging with?
Turn the idea into a question. Before adding or removing things, learn what navigation items visitors are currently using!
Answer: The amount of interaction roughly follows the order of the navigation items.
Portfolio and web design pages each get around 20% of the clicks. About, Blog and Contact each get 10% to 15% of clicks.
To see the path that people are following from any page, go to the Behavior > Site Content > All Pages report and click on the page, then click Navigation Summary. For us, we’re going to look at the home page. The Next Page Path is available on the right.
Analysis: Everything in the main navigation is getting clicked.
Things are working well. Be very careful changing the order or labels of these items. And think twice before adding or removing things!
Other questions you can answer using behavior reports…
-
Which topics are getting the most traction in our blog? (hint: All Pages + filter)
-
Which pages are the most popular entry points into our website? (hint: Landing Pages)
-
Which phrases are people typing into our search tool? Are they finding what they’re looking for? (hint: Search Terms + secondary dimension: exit pages)
See if you can answer these questions using your Behavior reports.
Insights from a Conversion Report
To find out if your marketing is working, answers can be found in the conversion reports.
Idea: Let’s ask for more information in our Contact Us form!
The more information we get from people, the better. More info equals warmer leads. Let’s ask for company size, project type, job title and ZIP code.
Question: What percentage of people who visit our contact page fill out and submit the form?
Adding to the form may reduce the percentage of people who complete the form. So let’s first understand where we are before we change anything.
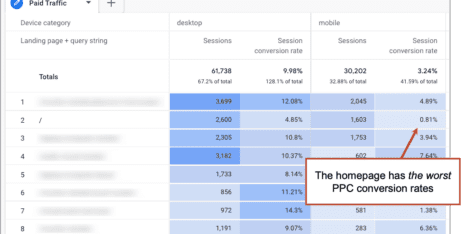
Answer: Currently, 14% of people who visit the contact page fill out the form.
Analysis: Let’s add to the form, but make it an experiment.
If the percentage goes down, let’s change it back. Then we can try the other approach of an even simpler form. That may increase the percentage of people who submit, converting from a visitor into a lead.
Other questions you can answer using behavior reports…
-
Which articles are inspiring people to subscribe to our newsletter? (hint: Reverse Goal Path – instructions here)
-
What percentage of ecommerce customers visit more than once before buying? (hint: Path Length)
-
What time of day are people least likely to take action? (hint: Goal Overview)
Try to find the answers these questions in your Analytics Conversion reports.
Observing vs. Thinking, Data vs. Evidence
There is an ocean of data in your Analytics. And it’s fun to swim in the ocean. But it doesn’t really get you anywhere. If you’re just looking at reports, without answering questions, testing hypotheses or drawing conclusions, you’re not doing Analysis.
So next time you have a marketing idea, turn it into a question and then go find the answer. This is the biggest difference between good and great marketing.