If you're responsible for generating sales and leads from your company's website, you probably spend a ton of time deep in analytics reports and spreadsheets looking for insights and ways to optimize your site to improve your conversion rates.
One of the biggest culprits hurting conversion rates is visitor confusion.
Visitors arrive on your site with a specific job to be done, and depending on the information, usability, utility, and persuasiveness of the site, they are either successful or unsuccessful.
This article will show you six ways you can uncover visitor confusion and improve your website performance.
The key to improving conversion rates is to remove confusion
Increasing conversion rates is all about removing visitor confusion. Removing that confusion results in a better performing website, in turn helping your business achieve its goals.
Think of conversion rate as a simple, formula:
Conversion Rate = Desire - Friction
In short, your conversion rate is driven by two opposing factors: user desire, and friction in the conversion funnel. User desire measures how badly the visitors to your site want what you have. Friction is how difficult it is for them to complete the job they've come to your site to do.
Your Web conversion funnel creates four combinations of experience:
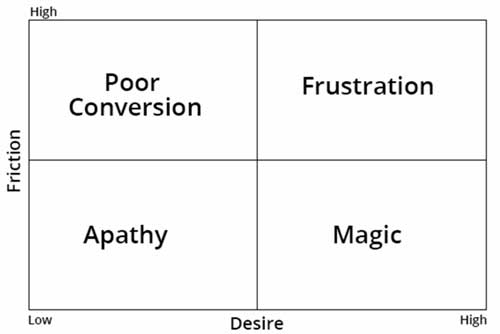
If desire is high but so is friction, you create frustration. If your funnel has really low friction, but you visitors have no desire, you have apathy. When visitors are confused, they're typically frustrated. It's up to you to remove that frustration.
Here are six ways to uncover visitor confusion on your site.
1. Review the top landing pages report
Though it may be convenient to think of your website as having a single homepage, the reality is much more convoluted. With Google delivering massive amounts of traffic to websites like yours based on user queries, the reality is you likely have 5-10 "homepages"—the primary landing pages of people who are arriving at your site via search engines.
We spend so much time on the homepage, but often so little time on optimizing those other essential "homepages" that provide the first interaction between users and your brands, products, and services.
You can uncover confusion with inbound visitors by looking at your top landing pages report and identifying those that have high bounce rates. A high bounce rate on a landing page represents a mismatch between what the user was searching for and what you were offering on that page. (A sample report from Google Analytics is pictured here, but you can perform this step in any popular analytics package.)
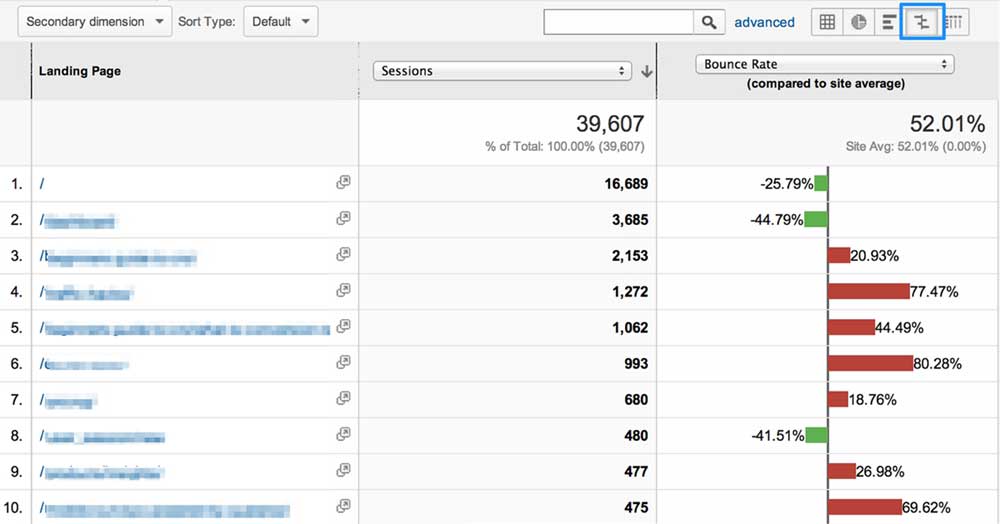 Sample landing page report from Google Analytics, with comparison view selected
Sort your pages by most traffic, and then use the comparison view to see which pages have the most severe bounce rate discrepancies (compared with the rest of your site). Focus your efforts on improving those underperforming pages first.
Investigate how those pages rank for specific queries, and do you best to align the inbound search intent of the visitor with your value proposition and call to action. The more aligned the landing page is with the inbound search, the higher relevance your page will have for the visitor, and the better your conversion will be.
2. Survey exiting visitors
One of the difficulties of discovering user confusion is that most confused visitors leave before you even get a chance to talk to them. By definition, they don't sign up for your newsletter, fill out a lead form, or make a purchase. But you do have a chance to talk to them—while they're still on the site.
Using exit-detection technology, you can use on-site surveys that are triggered when a visitor goes to leave the site. When the technology notices the user is going to type a new URL or navigate away from the site, a survey can be triggered to pop up. You can use this opportunity to ask the visitor whether they were able to complete the task they came to the site to complete.
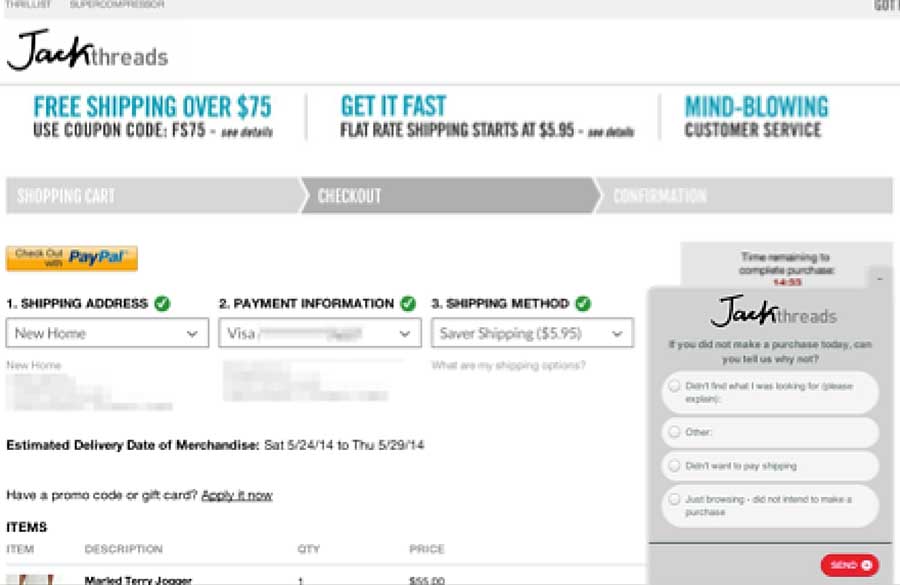 Sample exit survey on a shopping cart page
You can put the exit surveys on the pages with the highest exit and bounce rates so that you can learn what the issues are with those pages and funnel steps that are leading to the high abandonment rates.
3. Conduct user research
There are no shortcuts to really understanding what visitors are looking for and what's getting in their way. Your analytics package tells you what is happening on your website, user research tells you why. If you only rely solely on analytics data, you are guessing at what may be wrong, and guessing can be costly.
There is no simple trick to user research. It's hard work, which is why it yields such great insights that can help you stand out from the competition. How do you conduct user research? Try this three-pronged approach:
- Survey your users. Find out how they found you originally, why they still use you today, and what they love and don't love about your service. You can use email surveys, on-site surveys, or in-person interviews.
- Conduct user testing. Use a service such as usertesting.com to watch how people use your site and what issues they encounter while conducting their tasks.
- Talk to your support team. Find out what the most common questions or concerns are. Read live-chat transcripts, or ride along with support for the day. Get a deep understanding of what the most frequent challenges are for your site visitors.
By combining the feedback and insights from these three approaches to user research, you'll walk away with a deep understanding of customer needs and challenges; you can then go about testing your findings and improving your site.
4. Segment your visitors
The problem with analytics packages is that, by default, they show you all of your traffic—in aggregate. These same packages love to show average numbers, such as average bounce rate and time on site. However, aggregate and average numbers are terrible metrics for trying to uncover confusion.
Instead, segment your traffic to get specific insights about certain types of website visitors. By creating more targeted and meaningful segments, you can see differences that may lead to clues about what's broken and what to change.
For instance, if you segment first-time visitors and see that the vast majority are leaving on a particular cart page (whereas returning visitors fly right through), you can ask yourself—and them—why that's the case.
Try the following segments to kick-start your analysis (as recommended by ConversionXL):
- Segment by traffic source. Which sources bring in the best visitors? Which landing pages work better for each source? What are their specific needs?
- Segment by behavior. How are new and returning visitors different? People on mobile devices?
- Segment by outcome. Focus on groups of people who convert better and ask questions about what makes them unique.
By looking at different segments, you can find which types of visitors are able to move easily through your site and others who get confused and leave in droves. By learning the differences between these groups you can find areas of opportunity to improve the experience for the right visitors.
5. Conduct a post-conversion survey
One of the best groups of people to help you uncover confusion and friction in your website are those who recently completed a purchase or conversion.
The people who recently made it through your site to the ultimate conversion are some of the best people to point out the friction points that almost hung them up during the process.
For example, if your successful online shoppers say that questions about your return policy almost tripped them up, then you can be sure that other visitors who aren't as confident or motivated are leaving for those same reasons. Much like an obstacle course with a large wall, some will make it over; but you'll find many who get stuck and are unable to progress.
By deploying a post-conversion survey, you can ask recently converted users what those sticking points were, as well as what it was that got them over the hurdle.
Try these two questions with successful visitors to gain insights about a confusing part of your funnel:
- What almost stopped you from completing your purchase today?
- What was the one thing that most persuaded you to complete your purchase?
6. Review your funnel exit report
I'm amazed at how many companies don't have their funnel reports properly configured in their analytics packages. But for those that do, the funnel exit report is the place to drill down.
Combined with the segmentation, surveying, and user-research ideas noted earlier, you can gain deep understanding of user behavior and page performance within your ultimate conversion funnel to find opportunities for improving conversion rates.
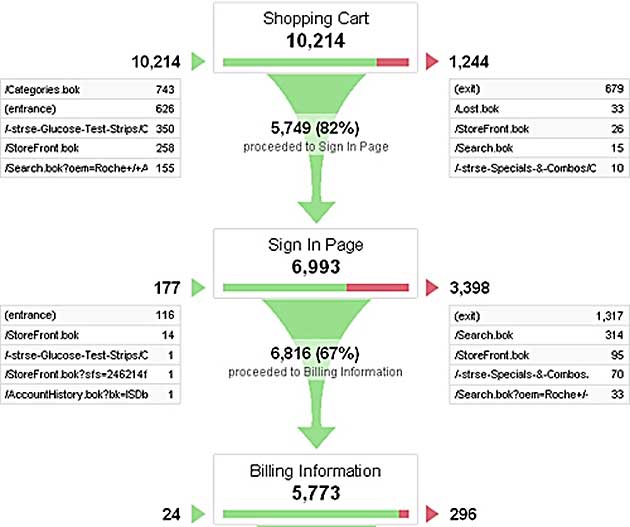 Sample Funnel Visualization report from Google Analytics (image by MoreVisibility)
Look at the pages that are leaking the most visitors. Focus on the pages that have the highest exit rates to discover why. Do you have high conversions from product page to the cart, but break down from step one to two during checkout? Or maybe you suffer a massive leak from product to cart page? All of these can be pointing to confusion during the conversion process that can be diagnosed and then tested to improve performance.
You can do a similar analysis of any funnel—not just a shopping experience.
Uncover and eliminate visitor confusion
Visitor confusion is a conversion killer, but you'll have to go beyond high-level analytics reports to really get to the bottom of it. Stop guessing and roll up your sleeves to get to the why behind the analytics. Once you start surveying users and going deep to understand behavior, you'll be able to unlock new insights that can lead to successful A/B tests and optimizations to improve the performance of your website.
Guessing your way through changes to your website is wasteful and expensive. Finding points of user confusion can guide your site improvement plan and deliver real wins that matter to your key business objectives. When you reduce confusion, you reduce friction and improve the conversion rate of your site.