Can you buy a Police Commissioner? Spending at the 2012 Police and Crime Commissioner elections suggests it depends on the party
The Police and Crime Commissioner elections were widely considered to be disastrous, with exceptionally low voter turnout and a lack of public interest in, or understanding of, their roles. Chris Prosser of St Catherine’s College, Oxford, looks at the newly released Electoral Commission figures for spending in the election, and lifts the lid on what was spent by who, and to what end.

The election night count for the West Midland Police and Crime Commissioner (Credit: Birmingham News Room, CC by 2.0)
Just under a year ago the first Police and Crime Commissioner elections were held in England and Wales. Two weeks ago, the Electoral Commission released data on candidate donations and spending at those elections. In total, candidates spent £2.1 million – an average of £11,220 each. For comparison, candidates at the 2010 general electiononly spent £6,284 each (but this doesn’t count party spending, which was much lower at the Police Commissioner elections). Media reporting of the data tended to concentrate on the more extreme cases of candidate spending – the Conservative candidate who spent £98,751 and didn’t win, or the independent candidate who (officially at least) didn’t spend a single penny and won.
The casual observer might then be forgiven for thinking that candidate spending had no impact on the outcome of the Police Commissioner elections. However, as any good social scientist will tell you, outliers often obscure trends rather than indicate them.
Campaign spending is a much studied topic in political science and the consensus is thatspending more money gets more votes. One of the key insights about campaign spending is that it tends not to change voters’ minds about who to vote for but rather whether or not they bother turning out to vote at all.
With this in mind and given the fact that turnout at the Police Commissioner elections was a record low 15%, I decided to subject the data released by the Electoral Commission to some quick statistical analysis. The results are unambiguous: spending more money increased a candidate’s probability of winning the election. Perhaps more interestingly though is that the effect of spending was different depending on the party of the candidate. As I’ve illustrated in the graph below, the effect of campaign spending is most pronounced for Labour: when a Labour candidate doesn’t spend much money they have a tiny chance of winning, but if they spend enough money the model predicts victory with near certainty. In contrast, the effect of spending for Conservative candidates is much more muted: although spending more money increases their probability of winning, they have to spend much more than Labour candidates for a fraction of the result.
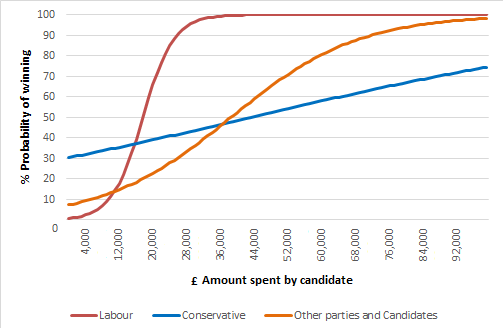
Predicted conditional probabilities of winning a Police and Crime commissioner by the amount spent by a candidate running against the mean number of opponents (4) who each spend the mean amount (£11,220).
We should of course take these results with a grain of salt – the sample size is quite small. The near certainty of a predicted Labour victory above a certain threshold is largely driven by five Labour candidates who spent over £28,000, all of whom were victorious (by contrast 11 Conservative candidates spent more than £28,000 but only 5 of those won). I do think though that the model is capturing some real difference between the effects of Conservative and Labour spending, even if those differences are likely to be more muted in reality. From a purely demographic perspective, Conservative voters – who tend to be older and richer than other voters – are also those who are more likely to turn out in general. We shouldn’t be surprised then that campaign spending – which largely operates on turnout – has more effect for candidates whose voters require a little more persuasion to get out and vote, than those who will turnout regardless.

The Electoral Commission also provides a brief breakdown on what candidates actually spent their money on, illustrated in the graph above. In order to investigate the effects of spending on different types of things, I substituted the breakdown of spending for the total amount candidates spent and re-ran my model. Again the results are unambiguous: only one type of spending had any influence on electoral outcomes – what the Electoral Commission calls ‘unsolicited materials’. These are the flyers that come flooding in through your door at every election. This is good news for political parties, who spend much of their resources on printing and distributing these flyers at every election. Alas, this is not great news for those of us who wish we didn’t have to fill our recycling bins quite so high come election time.
Note: this article represents the views of the author, and not of Democratic Audit or the LSE. It originally appeared on the Politics In Spires blog and can be seen here.
Chris Prosser is a Dphil student in Politics at St Catherine’s College, Oxford, a lecturer in Politics at Christ Church, Oxford, and a graduate deputy editor of Politics in Spires. His research focuses on the domestic politics of the European Union but he is also interested in British politics, political parties, electoral systems, and voting behaviour. He studied politics, philosophy, and psychology at the Australian National University, followed by an MPhil in Politics: Comparative Government at the University of Oxford.
Shortened URL for this post: https://buff.ly/18uzNwf
Similar Posts
Subscribe
If you enjoyed this article, subscribe to receive more just like it.


 Democratic Audit's core funding is provided by the Joseph Rowntree Charitable Trust. Additional funding is provided by the London School of Economics.